MuGeN Paper Supplementary Information

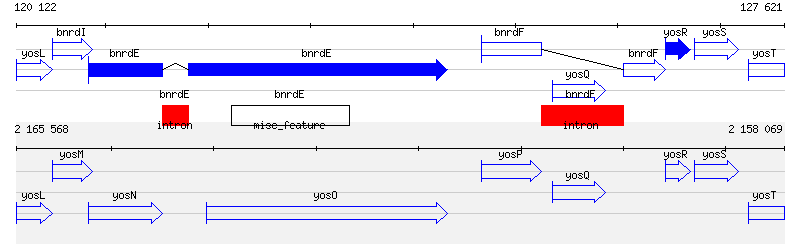
Figure S1: Annnotation differences in to GenBank entries covering an identical DNA portion
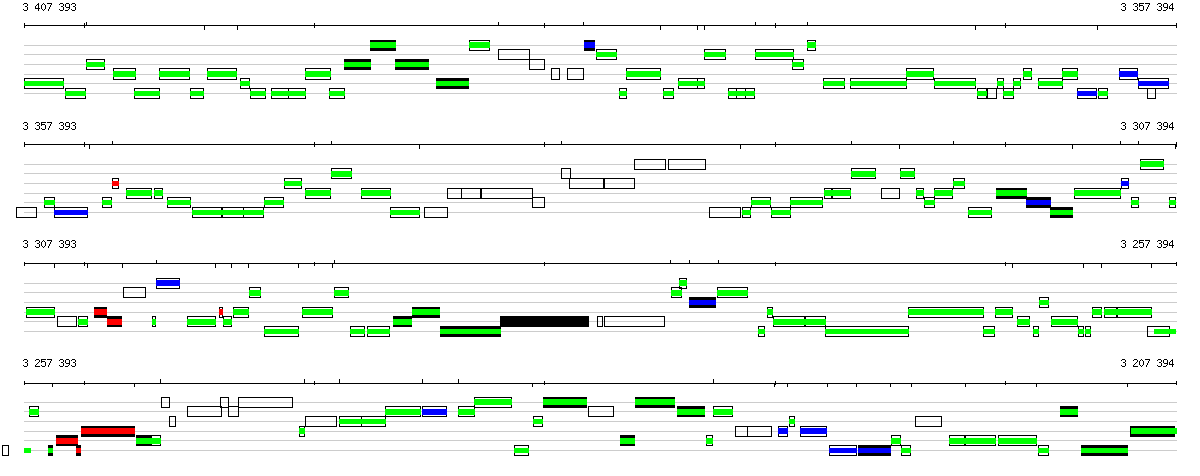
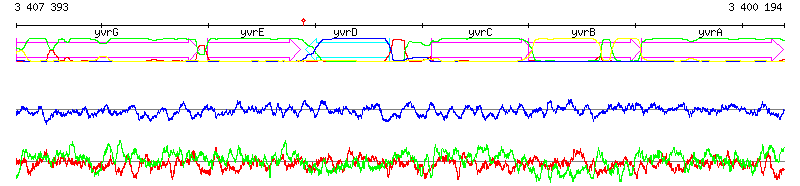
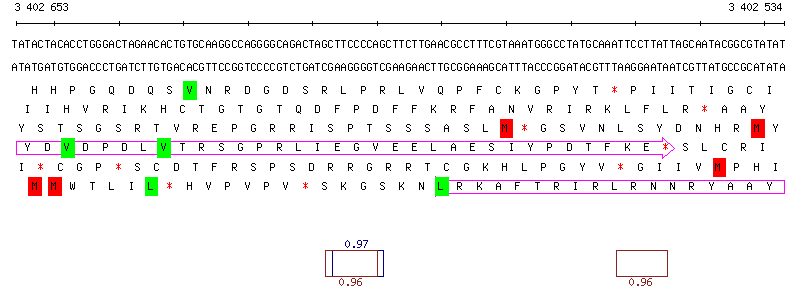
Figure S2: MuGeN analysis result output samples at different detail levels
Listing S1: boxplot XML file
Listing S2: MuGeN generated client-side image map HTML code
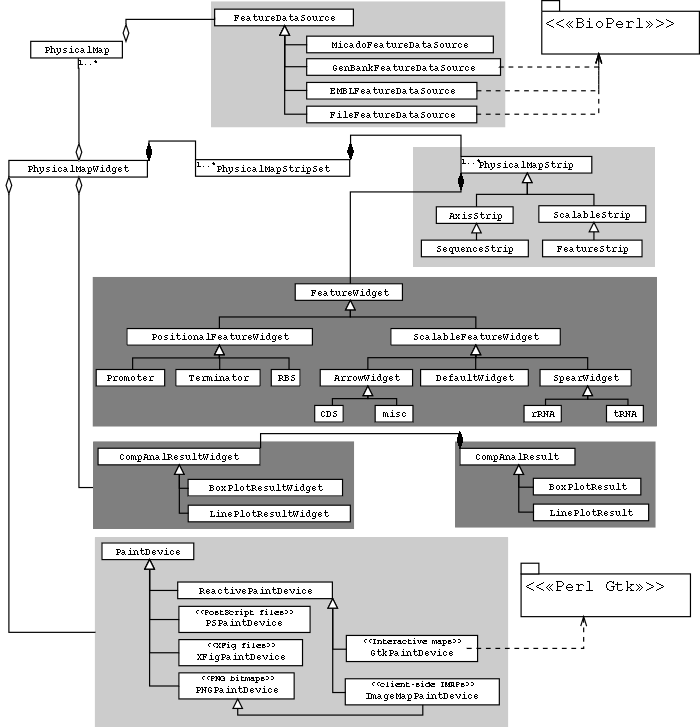
Figure S3: MuGeN class architecture.
|
Figure S1: Annnotation differences in to GenBank entries covering an identical DNA portionImage generated by the MuGeN software package showing two GenBank entries covering an identical genome portion. The top half shows part of entry AF020713 defining the complete genome of Bacteriophage SPBc2 which is integrated in B. subtilis. The bottom half shows part of entry NC_000964 containing the complete genome of B. subtilis. Both lines cover 7.5 kb starting at gene yosL and ending with gene yosT (partially displayed). CDSs are depicted by blue arrows located in their respective reading frames. Entry AF020713 has annotations for two genes, bnrdE and bnrdF, containing an intron (filled red boxes), which are absent from entry NC_000964. Both genes code for two ribonucleotide reductase subunits. The bnrdE intron contains an intein coding sequence, and bnrdF bears similarities with homing endonucleases (Lazarevic et al, 1998). |
Figure S2: MuGeN analysis result output samples at different detail levelsSample line and box plots. (a) Bird's eye view of a 200 kb portion of the genome of B. subtilis. In each reading frame, black boxes represent CDSs of known function and empty boxes CDSs of unknown function. A box plot generated from the output of a new codon usage classification program based on a mixture model is superposed on the CDSs : green boxes denote genes maintaining a low or intermediate level of expression, blue boxes denote highly expressed genes and red boxes denote potential horizontal gene transfers. (b) 7 kb portion of the genome of B. subtilis encompassing genes yvrG, yvrE, yvrD, yvrC, yvrB and yvrA. Superposed on the features is a line plot of the 4 probability profiles generated with RHOM (Nicolas, et al., 2002), below the features are a GC % plot (blue) , and a mixed GC-skew plot (red) and AT-skew plot (green). (c) Sequence view showing the overlap of genes yvrC and yvrB in B. subtilis. The two topmost lines show the DNA sequence, the six lines below show the translations in all reading frames, with red stars indicating stop codons. A box plot highlighting start codons is superposed on the translation lines, with red boxes for Met codons and green boxes for Leu and Val codons. Another box plot, showing potential ribosome binding sites is shown below the translation frames. Numbers above and below the boxes are probabilities associated to the potential RBSs. |
Listing S1: boxplot XML file
<companalresults>
<boxplot type="overlay" comment="GETORF output">
  <box begin="641" end="841" strand="1" frame="2"
     thickness="0.25" filled="yes" color="green"/>
  <box begin="1418" end="1579" strand="1" frame="2"
     thickness="0.25" filled="yes" color="green"/>
  <box begin="349" end="1722" strand="1" frame="1"
     thickness="0.25" filled="yes" color="red"/>
(...)
  <highlights>
     <highlight label="Largest ORF 1 (5967 b.)"
               begin="147777" end="155743"/>
     <highlight label="Largest ORF 2 (4338 b.)"
            begin="476505" end="482842"/>
(...)
   </highlights>
</boxplot>
</companalresults>
|
Listing S2: MuGeN generated client-side image map HTML code<map name="physicalmap"> (...) <area alt="sipS" title="sipS" coords="205,125,222,145" href="http://machine.org/bioinfo/genmap.cgi?access=Z99116&tag=CDS&name=sipS&start=36289&end=36843"> <area alt="ypzC" title="ypzC" coords="231,67,238,87" href="http://machine.org/bioinfo/genmap.cgi?access=Z99116&tag=CDS&name=ypzC&start=37110&end=37346"> (...) </map> |
Figure S3: MuGeN class architecture. |
|
Last modified by Mark Hoebeke (hoebeke) on 2003-01-08 09:12:56 via WML 2.0.6 (25-Oct-2000).
|