| Supplementary data of the associated publication Start Page |
|
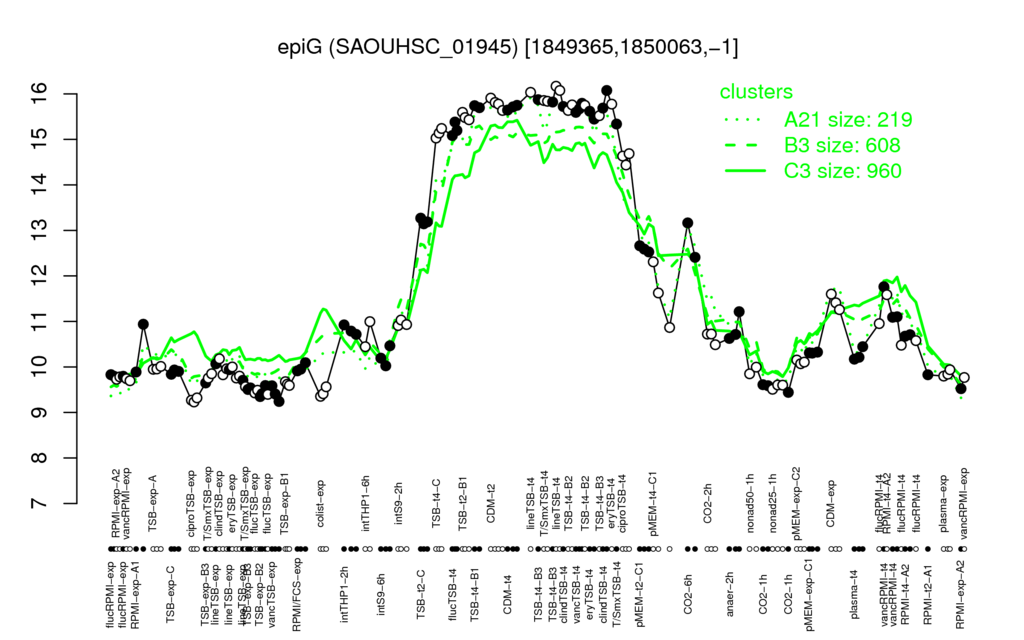
| lineTSB-t4 | clindTSB-t4 | CDM-t2 | TSB-t4-B3 | TSB-t4-B1 |
| 16.1 | 15.8 | 15.8 | 15.7 | 15.7 |
| ciproTSB-exp | vancTSB-exp | flucTSB-exp | colist-exp | TSB-exp-B2 |
| 9.27 | 9.41 | 9.44 | 9.44 | 9.45 |
| epiE | S770 | epiF | S769 | crtN | SAOUHSC_02772 | S1078 | SAOUHSC_02771 | S1182 | SAOUHSC_00318 |
| 1 | 0.99 | 0.99 | 0.98 | 0.98 | 0.97 | 0.97 | 0.97 | 0.97 | 0.97 |