| Supplementary data of the associated publication Start Page |
|
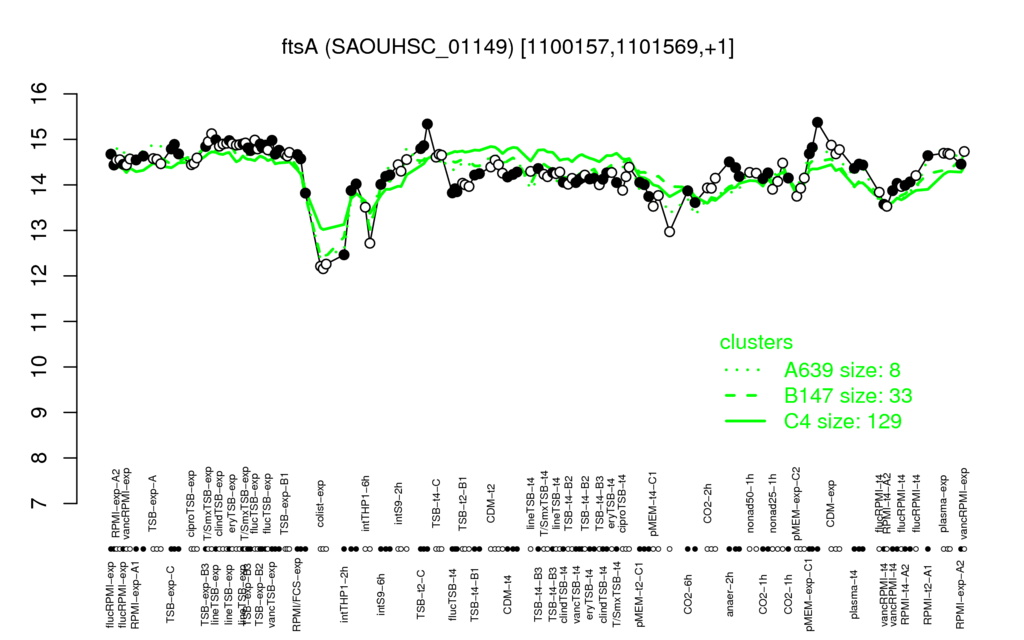
| TSB-t2-C | T/SmxTSB-exp | pMEM-exp-C1 | lineTSB-exp | clindTSB-exp |
| 15 | 15 | 15 | 15 | 14.9 |
| colist-exp | intTHP1-6h | pMEM-t4-C1 | intTHP1-2h | CO2-6h |
| 12.2 | 13.1 | 13.4 | 13.5 | 13.7 |
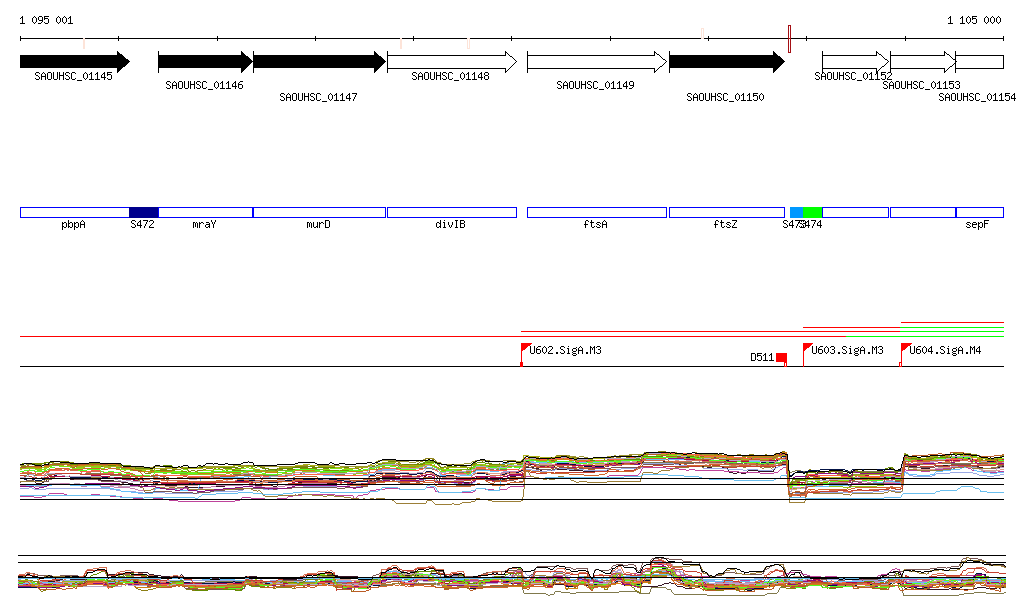
| divIB | papS | S613 | birA | smc | ftsY | SAOUHSC_01475 | sigH | SAOUHSC_01698 | aroE |
| 0.94 | 0.86 | 0.86 | 0.84 | 0.84 | 0.82 | 0.82 | 0.81 | 0.8 | 0.8 |
| moaC | bglR | SAOUHSC_00892 | S366 | SAOUHSC_02018 | S7 | SAOUHSC_00430 | SAOUHSC_02218 | S836 | SAOUHSC_00621 |
| -0.73 | -0.67 | -0.67 | -0.64 | -0.63 | -0.63 | -0.63 | -0.62 | -0.62 | -0.61 |