| Supplementary data of the associated publication Start Page |
|
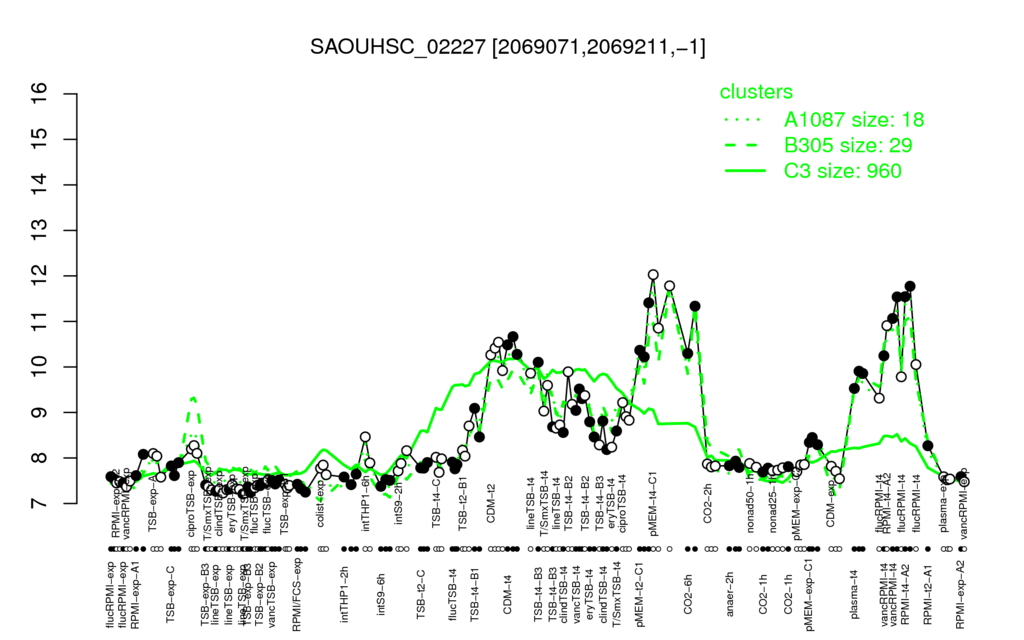
| pMEM-t4-C1 | RPMI-t4-A2 | vancRPMI-t4 | CO2-6h | pMEM-t2-C1 |
| 11.6 | 11.4 | 10.9 | 10.8 | 10.7 |
| lineTSB-exp | clindTSB-exp | T/SmxTSB-exp | RPMI/FCS-exp | TSB-exp-B3 |
| 7.26 | 7.28 | 7.3 | 7.33 | 7.34 |
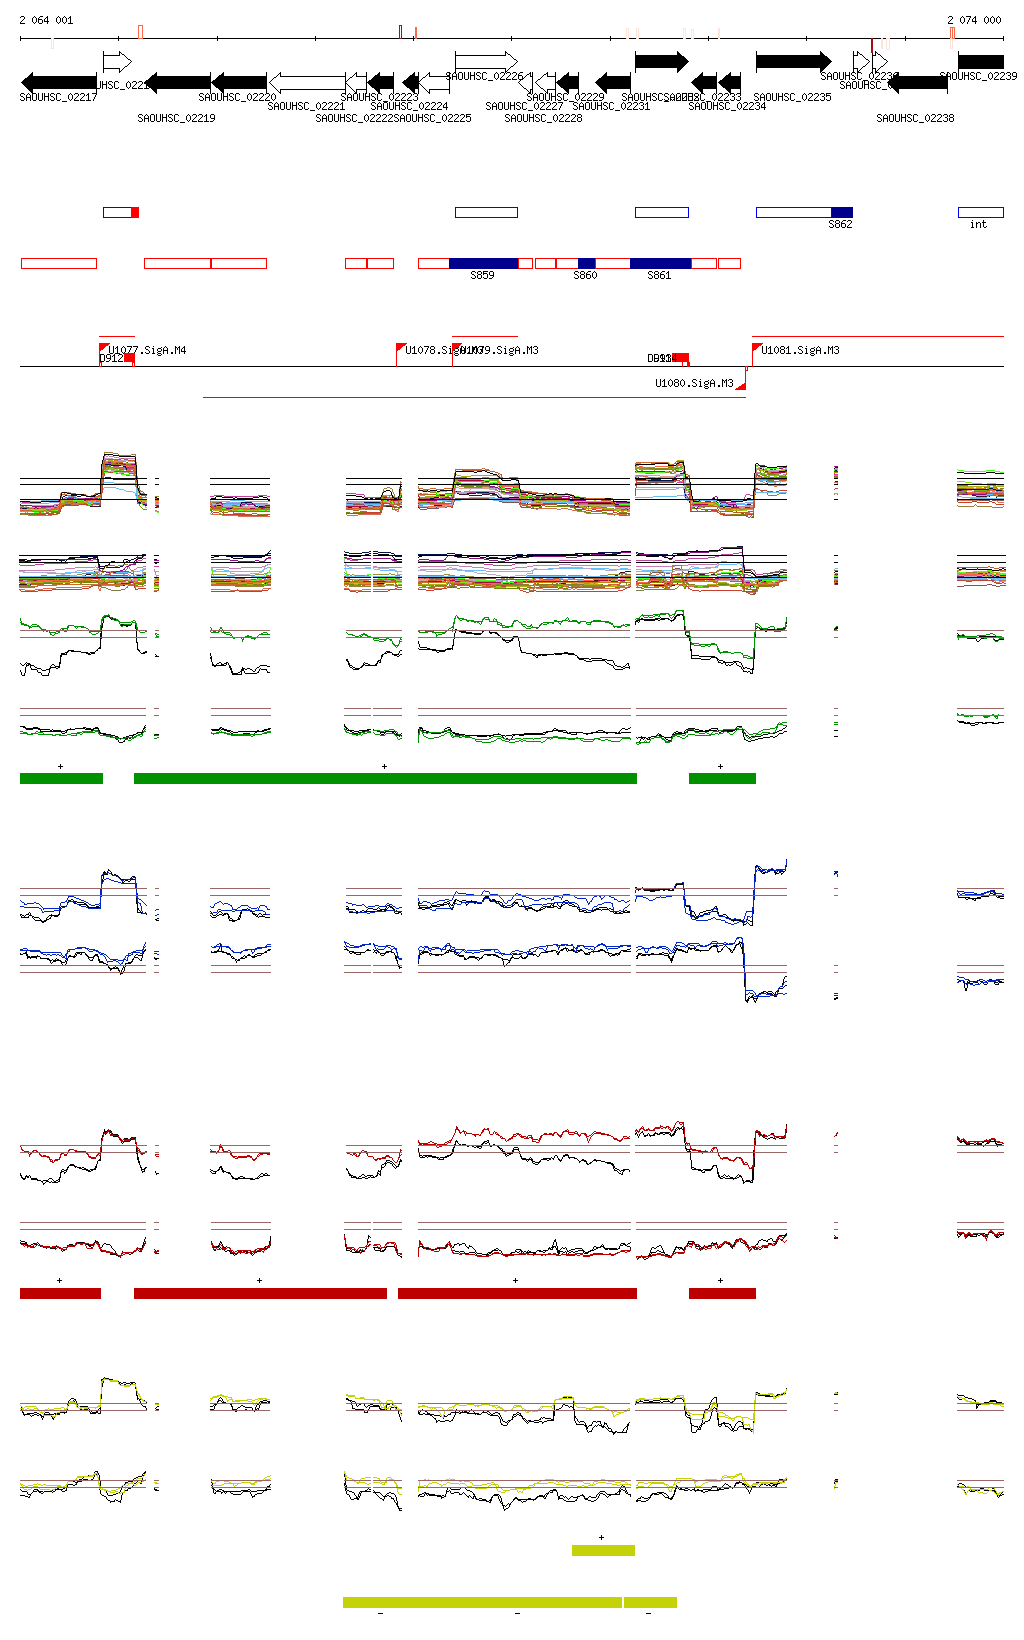
| SAOUHSC_02231 | SAOUHSC_02225 | S859 | SAOUHSC_02228 | S860 | SAOUHSC_02220 | SAOUHSC_02223 | SAOUHSC_02233 | SAOUHSC_02222 | SAOUHSC_02229 |
| 0.98 | 0.98 | 0.98 | 0.98 | 0.98 | 0.98 | 0.98 | 0.97 | 0.97 | 0.97 |
| thrS | S708 | SAOUHSC_00963 | atpC | atpD | serS | SAOUHSC_01876 | tgt | atpB | SAOUHSC_02351 |
| -0.81 | -0.81 | -0.8 | -0.79 | -0.78 | -0.78 | -0.77 | -0.77 | -0.77 | -0.77 |