| Start Page |
|
 |
| Start Page |
|
|
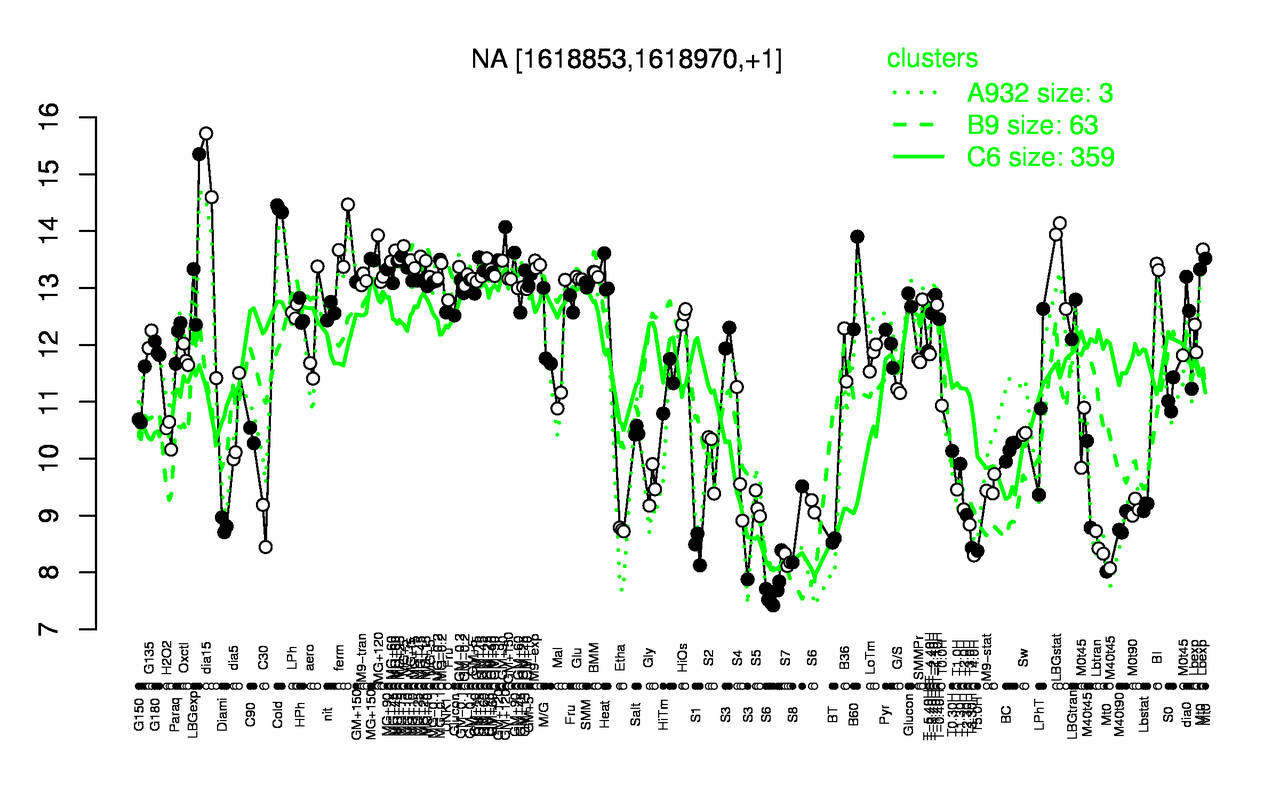
| Cold | dia15 | ferm | GM+120 | LBGexp | LBGstat | MG+60 | MG+150 | MG+t5 | MG+5 |
| 14.4 | 13.9 | 13.8 | 13.8 | 13.7 | 13.6 | 13.6 | 13.5 | 13.5 | 13.5 |
| S6 | S7 | T4.0H | T5.0H | T3.30H | S1 | Lbtran | BT | Etha | C30 |
| 8.04 | 8.21 | 8.3 | 8.38 | 8.43 | 8.43 | 8.49 | 8.56 | 8.75 | 8.82 |