| Start Page |
|
 |
| Start Page |
|
|
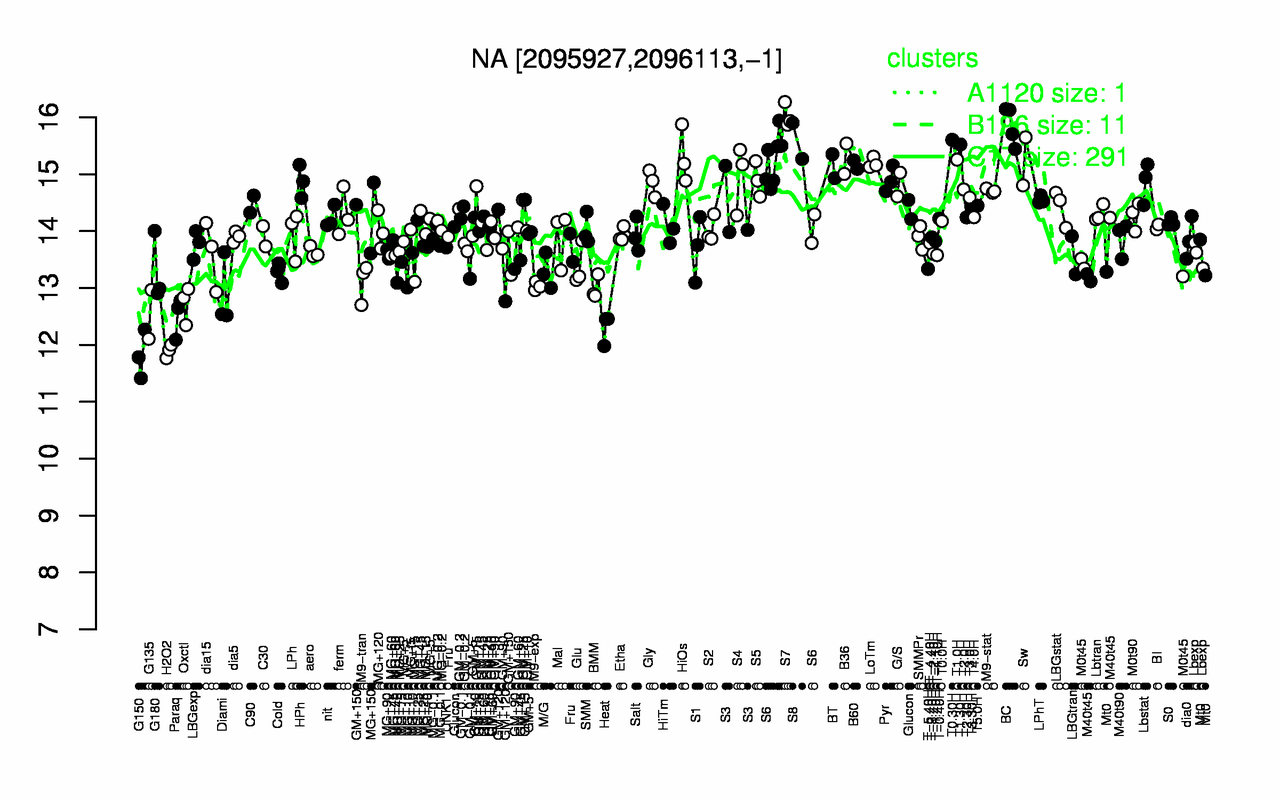
| S7 | BC | T0.30H | S8 | T1.30H | HiOs | B36 | T1.0H | Sw | LoTm |
| 16 | 15.9 | 15.6 | 15.6 | 15.5 | 15.3 | 15.3 | 15.3 | 15.2 | 15.2 |
| G150 | H2O2 | Heat | Paraq | G135 | Oxctl | Diami | BMM | M9-exp | M9-tran |
| 11.8 | 11.9 | 12.3 | 12.5 | 12.5 | 12.7 | 12.9 | 13 | 13 | 13.1 |