| Start Page |
|
 |
| Start Page |
|
|
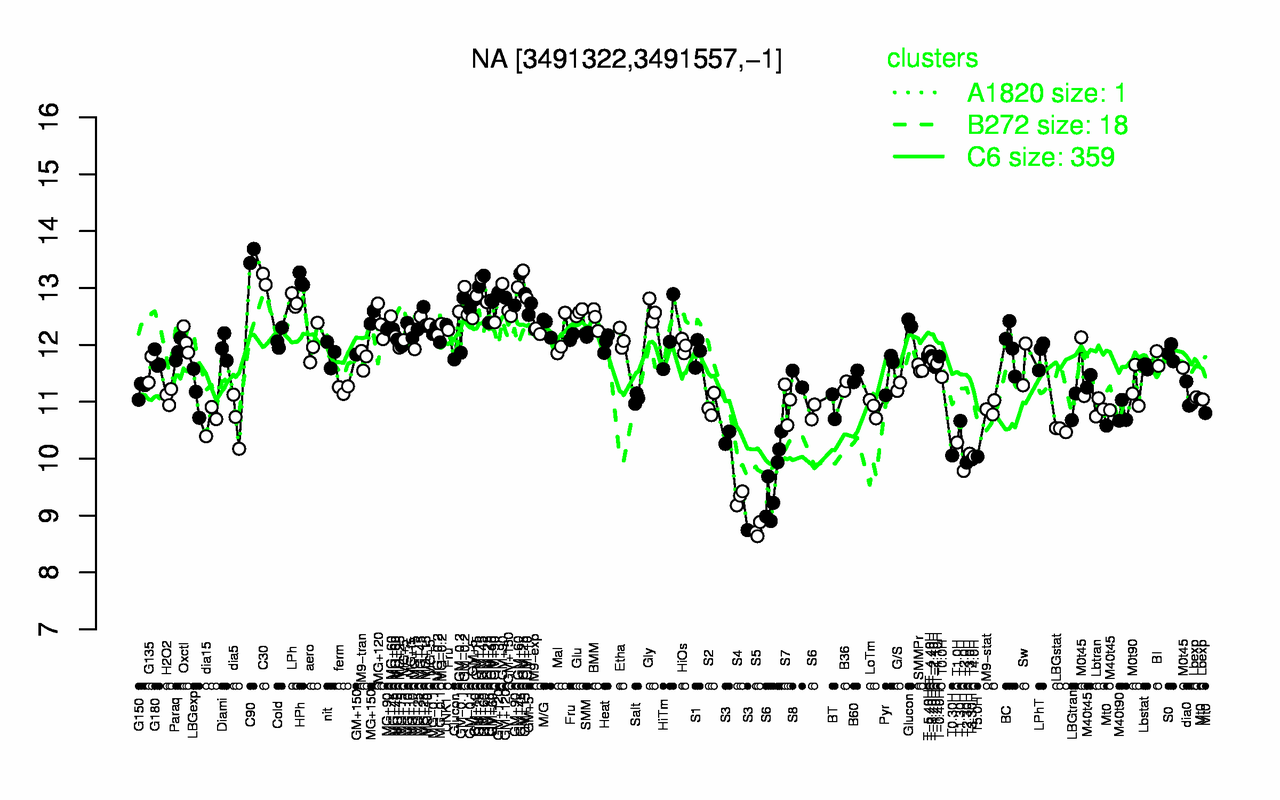
| C90 | C30 | HPh | GM+45 | GM+25 | GM+60 | GM+120 | GM+10 | LPh | GM+90 |
| 13.6 | 13.2 | 13.1 | 13.1 | 13 | 13 | 12.9 | 12.8 | 12.8 | 12.7 |
| S5 | S4 | T2.0H | S3 | S6 | T2.30H | T3.30H | T5.0H | T4.0H | T0.30H |
| 8.74 | 9.32 | 9.78 | 9.83 | 9.89 | 9.93 | 9.99 | 10 | 10 | 10.1 |