B. subtilis Expression Data Browser
Start Page
B. subtilis Expression Data Browser
Gene/Segment:
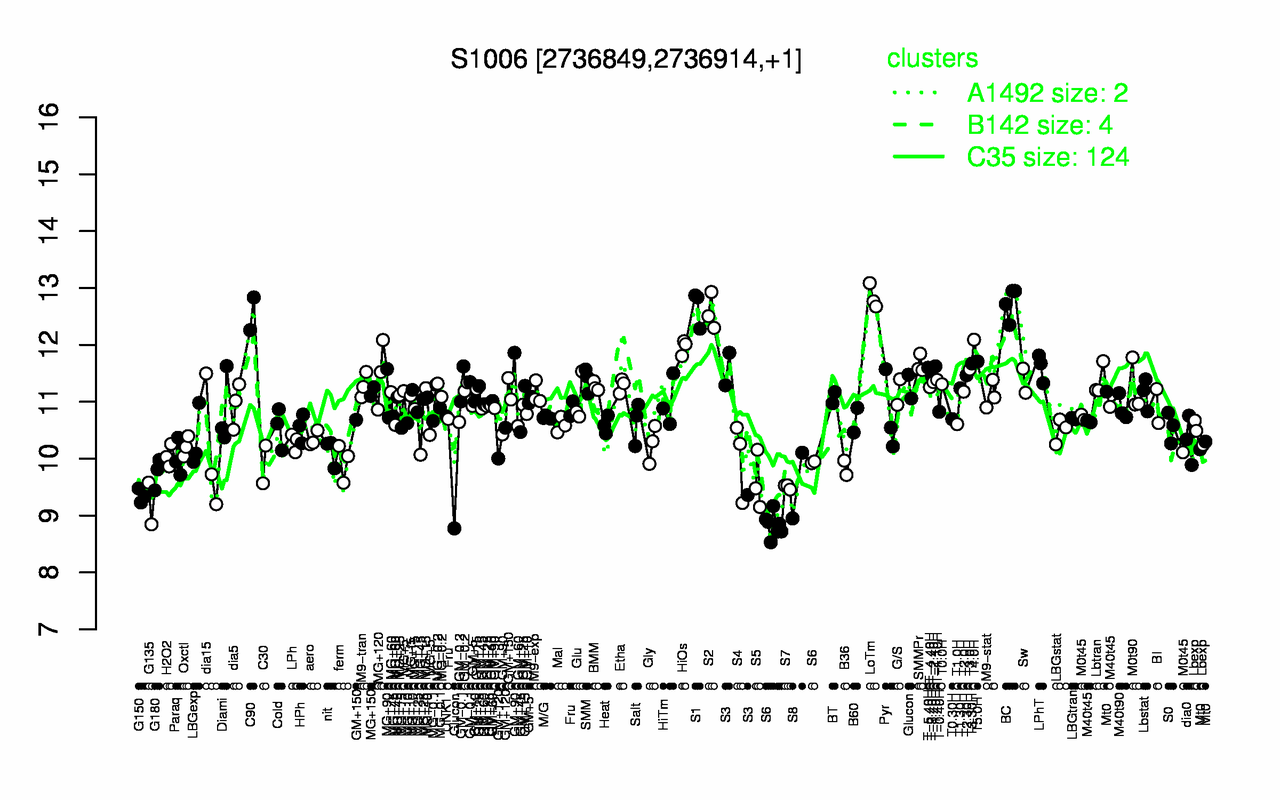
S1006
Locus Tag:
new_2736849_2736914
Details about S1006
Show/Hide
Highest Expression Conditions
LoTm
BC
S1
S2
C90
T4.0H
HiOs
T5.0H
T3.30H
SMMPr
12.8
12.7
12.7
12.6
12.5
12.1
12
11.7
11.7
11.7
Lowest Expression Conditions
S6
G135
G150
S7
S8
S5
G180
B36
C30
ferm
9.08
9.21
9.35
9.51
9.53
9.6
9.74
9.84
9.9
9.95
Most Positively Correlated Segments
yrpB
S614
rapI
yobF
pksB
S824
S712
bacA
ywfH
ypjP
0.85
0.75
0.74
0.72
0.71
0.69
0.68
0.68
0.67
0.67
Most Negatively Correlated Segments
yhcB
ytwI
yhbJ
yhcC
yhcA
S1280
S1432
ywkF
htrC
S592
-0.71
-0.71
-0.7
-0.69
-0.69
-0.66
-0.66
-0.64
-0.63
-0.63
Expression Profile of Segment S1006
Show/Hide
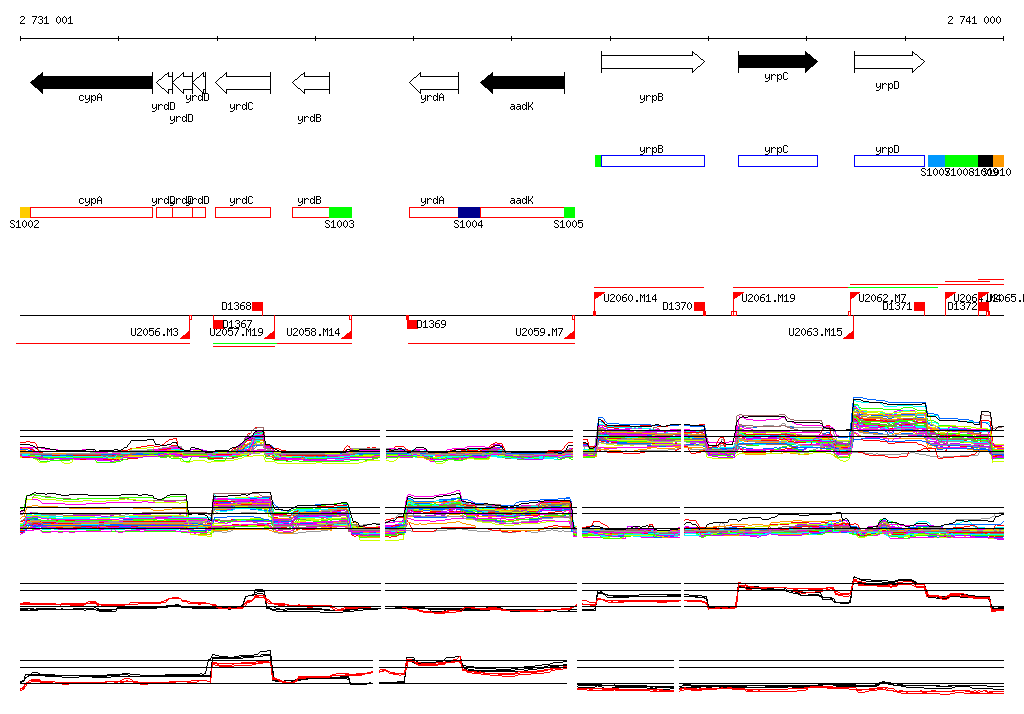
Genomic View of Gene/Segment S1006
Show/Hide
(Legend)
Browse Genome Context