| Start Page |
|
 |
| Start Page |
|
|
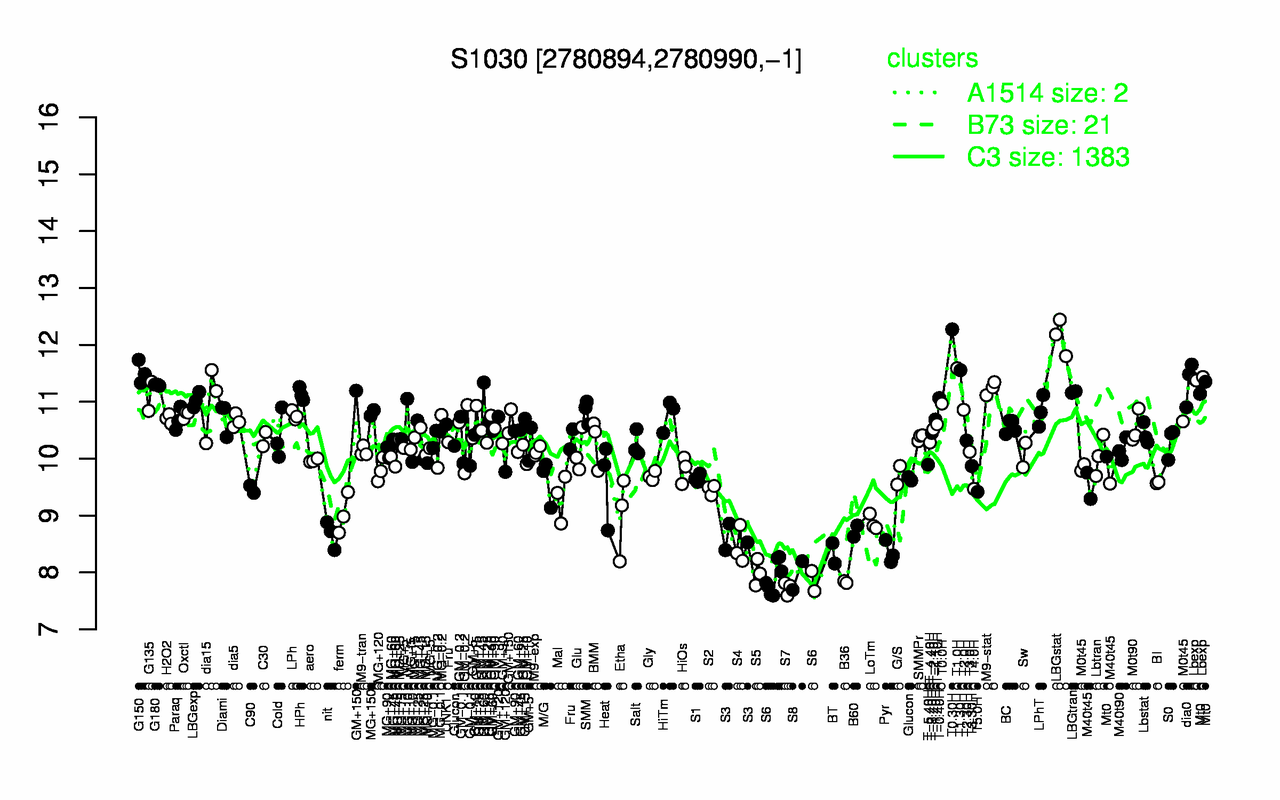
| T0.30H | LBGstat | T1.0H | T1.30H | G150 | Lbexp | dia0 | G180 | M9-stat | LBGtran |
| 12.3 | 12.1 | 11.6 | 11.6 | 11.5 | 11.4 | 11.3 | 11.3 | 11.2 | 11.2 |
| S7 | B36 | S6 | S8 | S5 | BT | Pyr | S4 | S3 | nit |
| 7.72 | 7.83 | 7.89 | 7.94 | 8 | 8.34 | 8.35 | 8.46 | 8.59 | 8.67 |