B. subtilis Expression Data Browser
Start Page
B. subtilis Expression Data Browser
Gene/Segment:
S1066
Locus Tag:
new_2882791_2882902_c
Details about S1066
Show/Hide
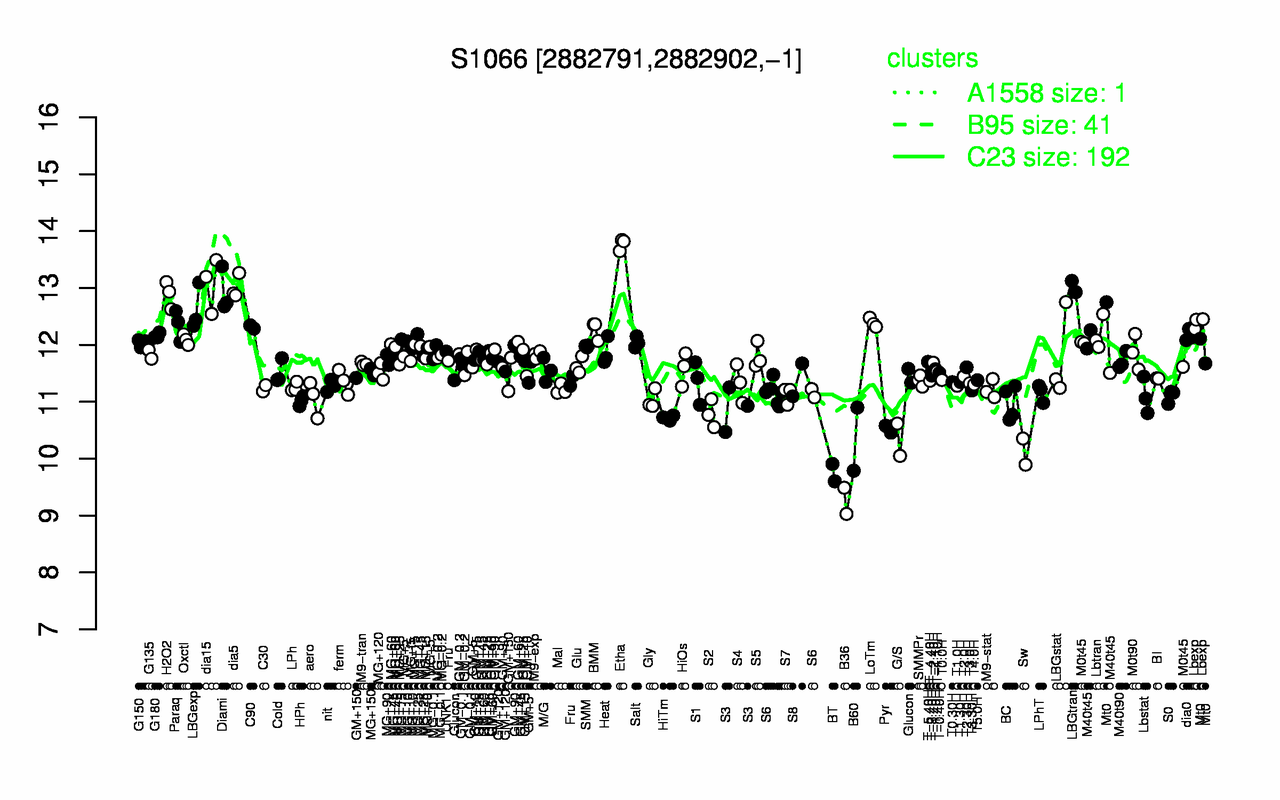
Highest Expression Conditions
Etha
dia15
LBGtran
dia5
Diami
H2O2
LBGexp
Lbexp
LoTm
Paraq
13.8
13.1
13
13
12.9
12.9
12.6
12.4
12.4
12.4
Lowest Expression Conditions
B36
BT
Sw
G/S
B60
Pyr
HiTm
S2
S3
BC
9.26
9.75
10.1
10.3
10.3
10.5
10.7
10.8
10.9
11
Most Positively Correlated Segments
ykoG
yktB
S670
yqaB
yhfI
yueI
lonA
S110
yueH
yneP
0.79
0.78
0.75
0.75
0.75
0.75
0.74
0.74
0.74
0.74
Most Negatively Correlated Segments
S717
S978
phrA
S809
rapA
S1111
phrH
ypqP
yfkN
S254
-0.71
-0.69
-0.67
-0.64
-0.64
-0.61
-0.6
-0.6
-0.6
-0.6
Expression Profile of Segment S1066
Show/Hide
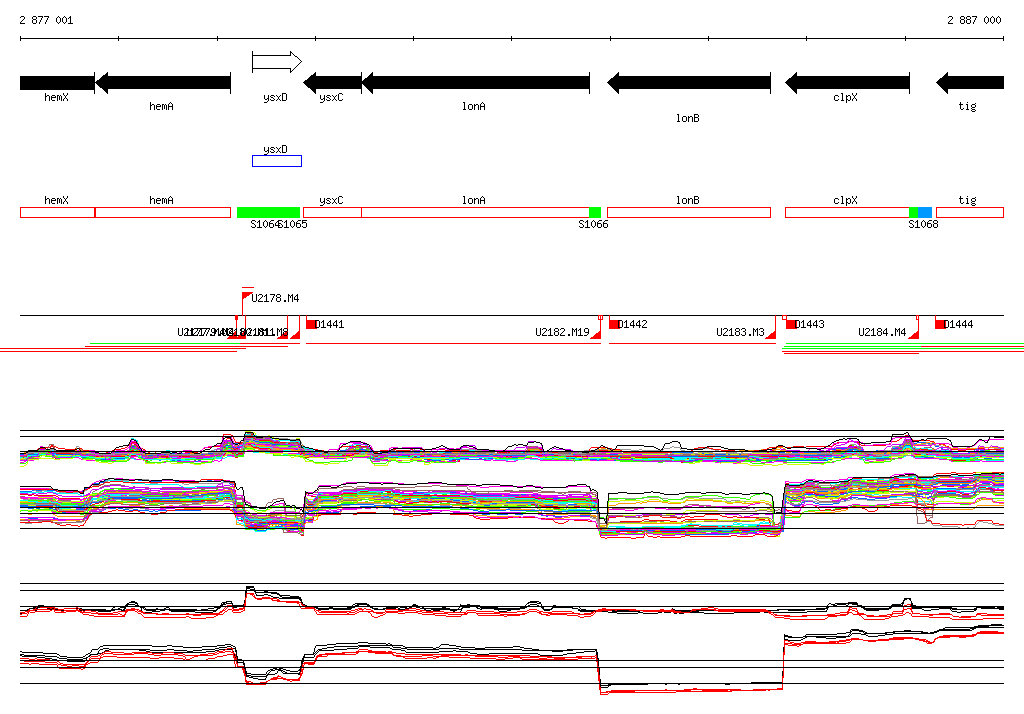
Genomic View of Gene/Segment S1066
Show/Hide
(Legend)
Browse Genome Context