| Start Page |
|
 |
| Start Page |
|
|
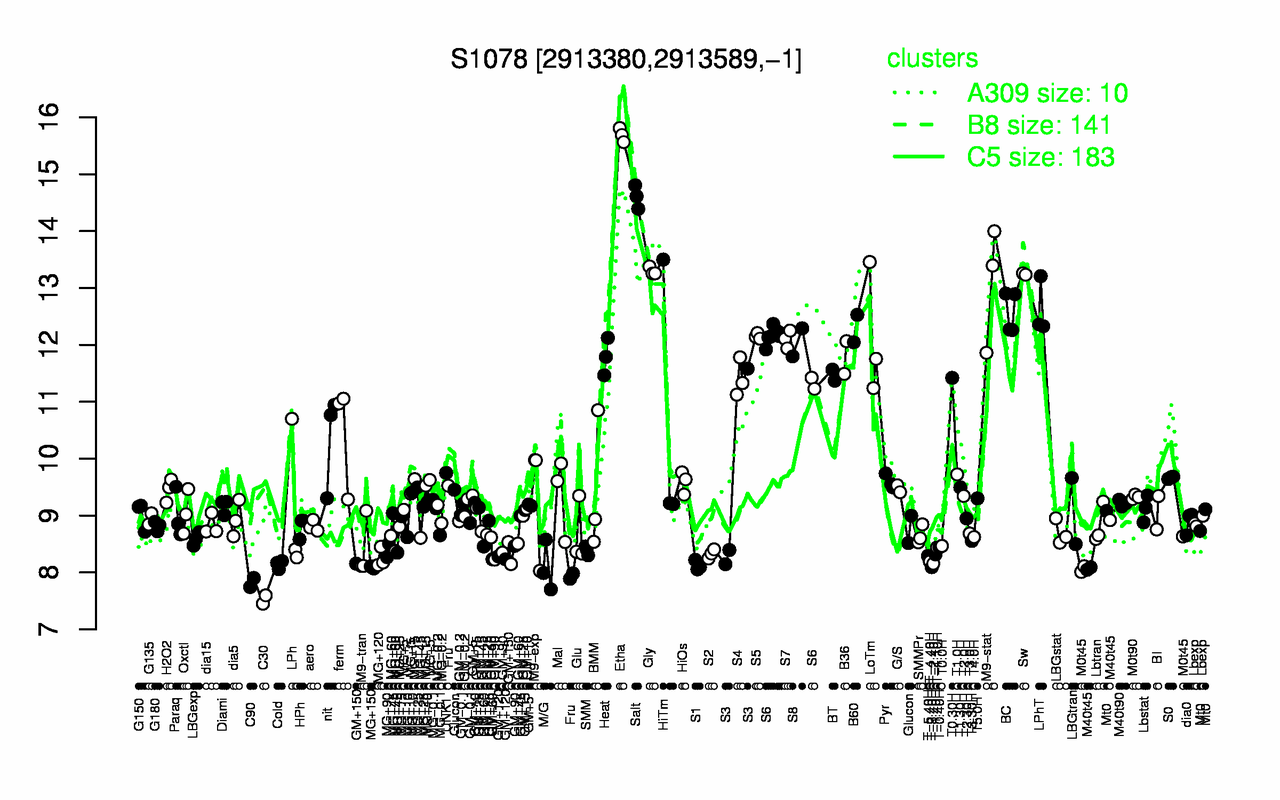
| Etha | Salt | Gly | Sw | M9-stat | LPhT | BC | B60 | S5 | LoTm |
| 15.7 | 14.6 | 13.3 | 13.2 | 13.1 | 12.6 | 12.6 | 12.3 | 12.2 | 12.2 |
| C30 | C90 | MG+150 | M/G | T-3.40H | S1 | Cold | T-2.40H | T-4.40H | M0t45 |
| 7.52 | 7.82 | 8.09 | 8.09 | 8.09 | 8.12 | 8.14 | 8.15 | 8.19 | 8.25 |