| Start Page |
|
 |
| Start Page |
|
|
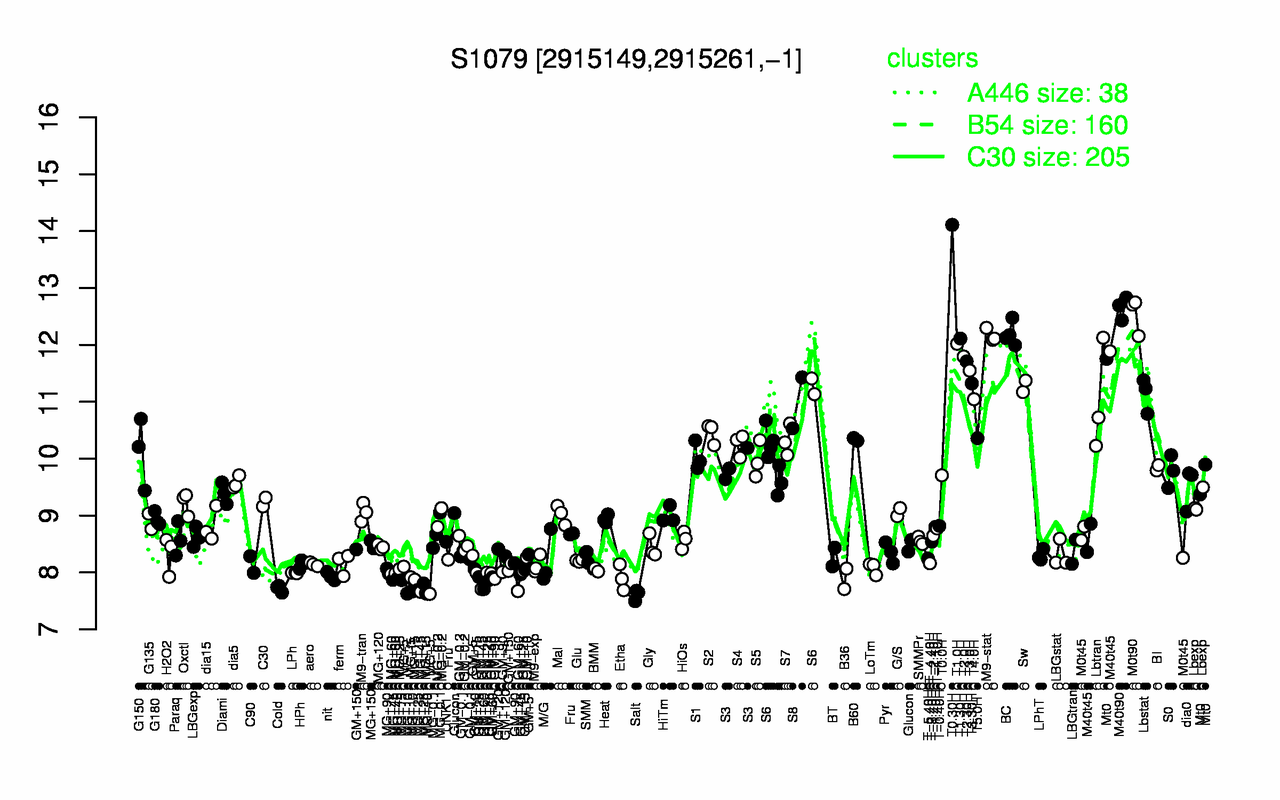
| T0.30H | M40t90 | M0t90 | BC | M9-stat | T1.30H | T1.0H | T2.0H | T2.30H | T3.0H |
| 14.1 | 12.7 | 12.5 | 12.2 | 12.2 | 12.1 | 12 | 11.8 | 11.7 | 11.5 |
| Salt | MG+10 | Cold | GM+60 | MG+15 | MG+45 | MG+25 | MG+5 | GM+45 | B36 |
| 7.61 | 7.64 | 7.72 | 7.77 | 7.79 | 7.81 | 7.85 | 7.86 | 7.89 | 7.89 |