B. subtilis Expression Data Browser
Start Page
B. subtilis Expression Data Browser
Gene/Segment:
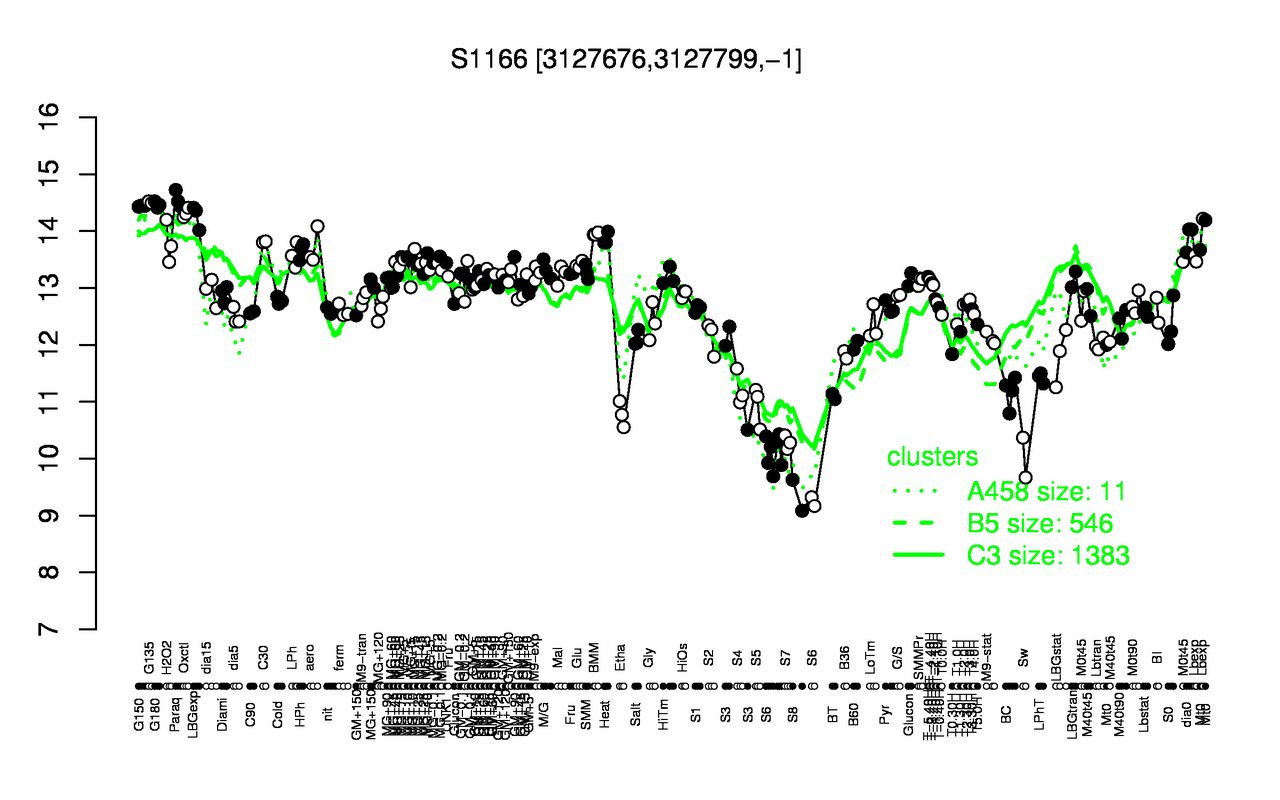
S1166
Locus Tag:
new_3127676_3127799_c
Details about S1166
Show/Hide
Highest Expression Conditions
Paraq
G135
G180
G150
Oxctl
LBGexp
BMM
dia0
Heat
C30
14.6
14.5
14.5
14.4
14.3
14.3
14
13.9
13.9
13.8
Lowest Expression Conditions
S8
S6
Sw
S7
Etha
S5
BT
BC
S4
LPhT
9.36
9.92
10
10.3
10.8
10.9
11.1
11.2
11.2
11.4
Most Positively Correlated Segments
asnB
yhcG
ylbH
spcB
oxaAA
yhcH
mreC
tig
yhcE
S237
0.9
0.89
0.89
0.88
0.88
0.88
0.88
0.88
0.88
0.88
Most Negatively Correlated Segments
yycQ
yhzD
yycO
yojJ
ytvB
yvaM
yqhP
mstX
yugO
yycP
-0.81
-0.8
-0.79
-0.79
-0.79
-0.79
-0.78
-0.78
-0.78
-0.77
Expression Profile of Segment S1166
Show/Hide
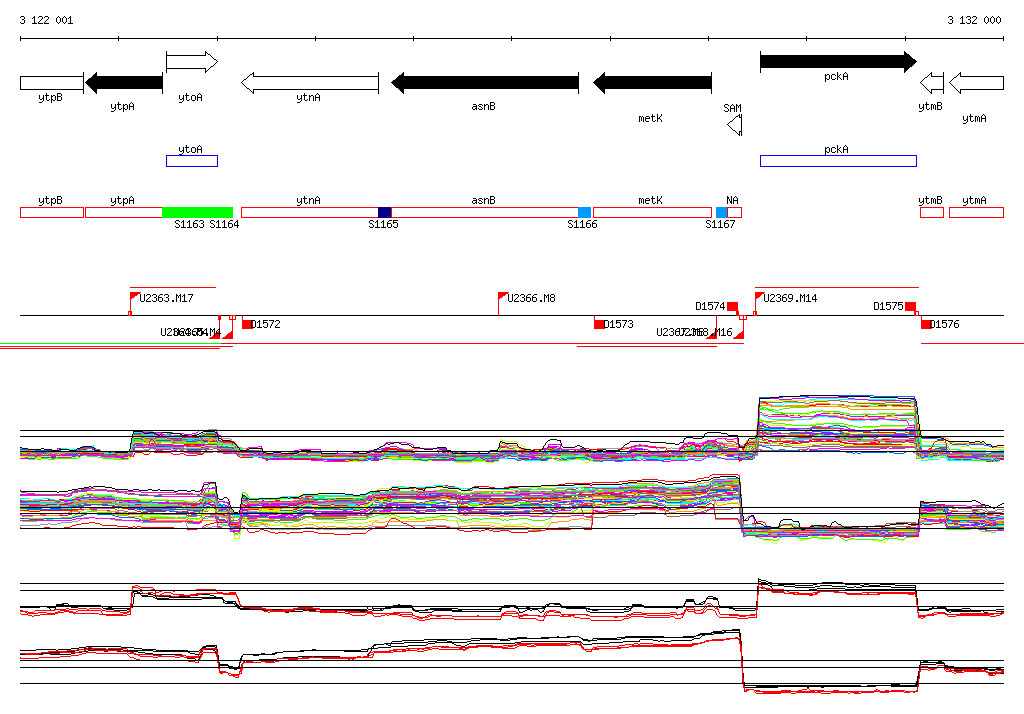
Genomic View of Gene/Segment S1166
Show/Hide
(Legend)
Browse Genome Context