| Start Page |
|
 |
| Start Page |
|
|
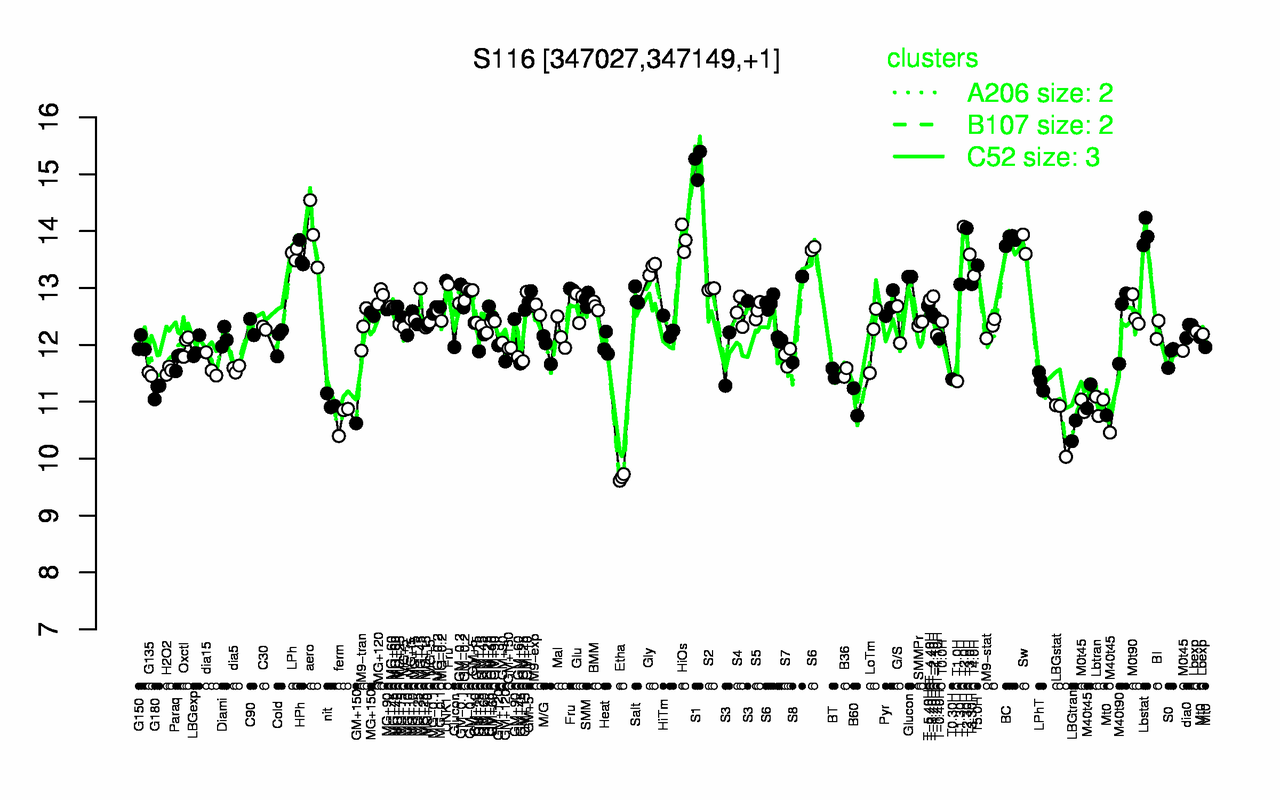
| S1 | T2.0H | T2.30H | Lbstat | aero | HiOs | BC | Sw | LPh | T3.0H |
| 15.2 | 14.1 | 14.1 | 14 | 13.9 | 13.9 | 13.8 | 13.8 | 13.6 | 13.6 |
| Etha | LBGtran | LBGstat | ferm | M40t45 | Lbtran | nit | B60 | G180 | M0t45 |
| 9.67 | 10.5 | 10.6 | 10.7 | 10.9 | 11 | 11 | 11 | 11.2 | 11.3 |