| Start Page |
|
 |
| Start Page |
|
|
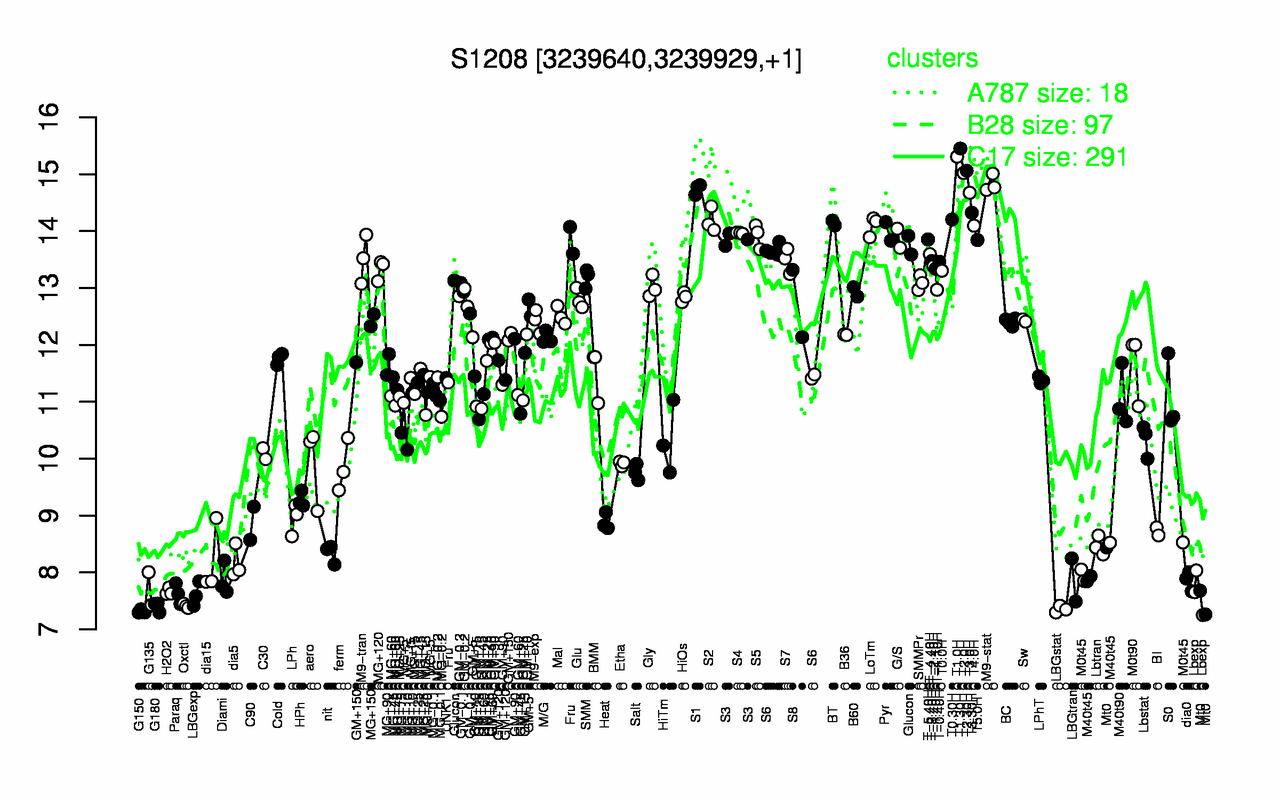
| T1.30H | T1.0H | T2.30H | T2.0H | M9-stat | S1 | T3.0H | T3.30H | T0.30H | S2 |
| 15.5 | 15.3 | 15.1 | 15 | 14.8 | 14.7 | 14.7 | 14.3 | 14.2 | 14.2 |
| G150 | LBGstat | G180 | Oxctl | LBGexp | Paraq | Lbexp | H2O2 | G135 | Mt0 |
| 7.32 | 7.35 | 7.4 | 7.41 | 7.61 | 7.63 | 7.65 | 7.66 | 7.72 | 7.79 |