| Start Page |
|
 |
| Start Page |
|
|
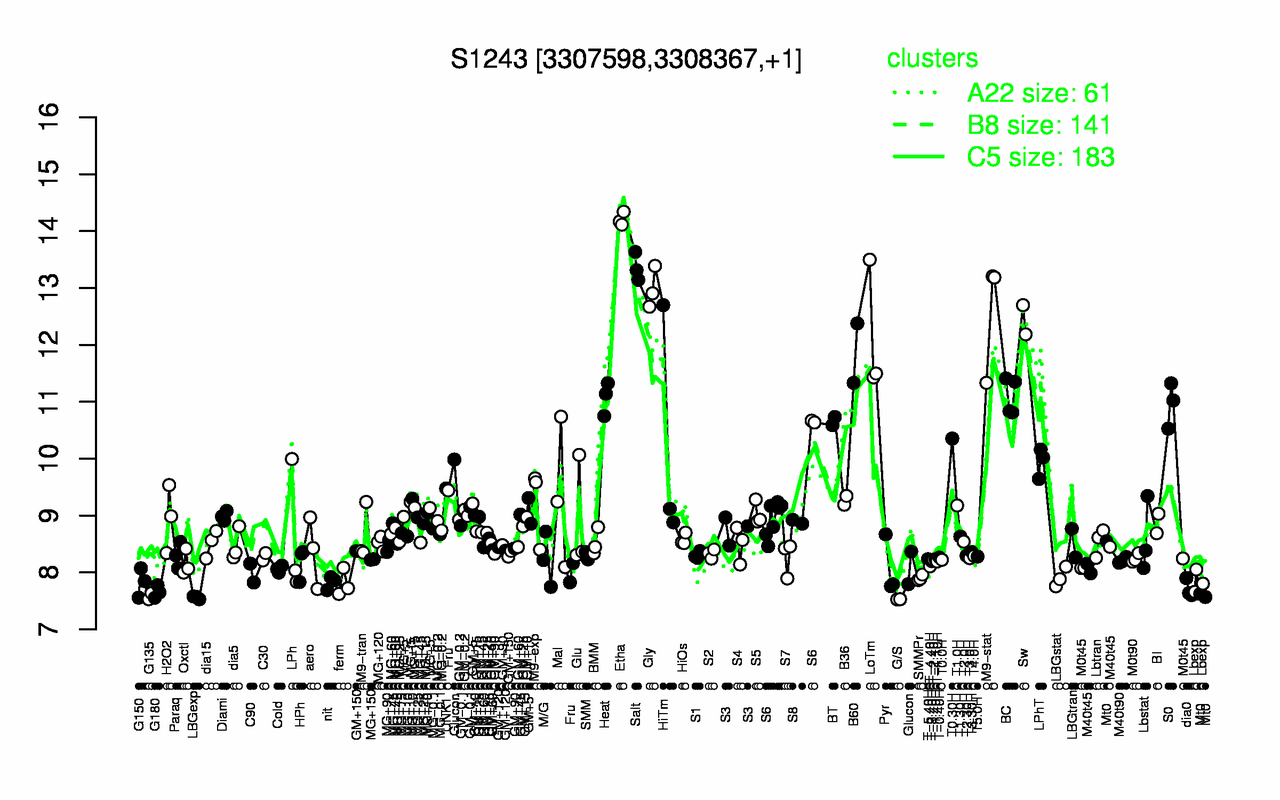
| Etha | Salt | Gly | M9-stat | Sw | LoTm | B60 | BC | Heat | S0 |
| 14.2 | 13.4 | 13 | 12.6 | 12.4 | 12.1 | 11.9 | 11.1 | 11.1 | 11 |
| G/S | LBGexp | G135 | G180 | dia0 | ferm | nit | G150 | Lbexp | SMMPr |
| 7.53 | 7.56 | 7.58 | 7.66 | 7.71 | 7.81 | 7.82 | 7.83 | 7.84 | 7.91 |