| Start Page |
|
 |
| Start Page |
|
|
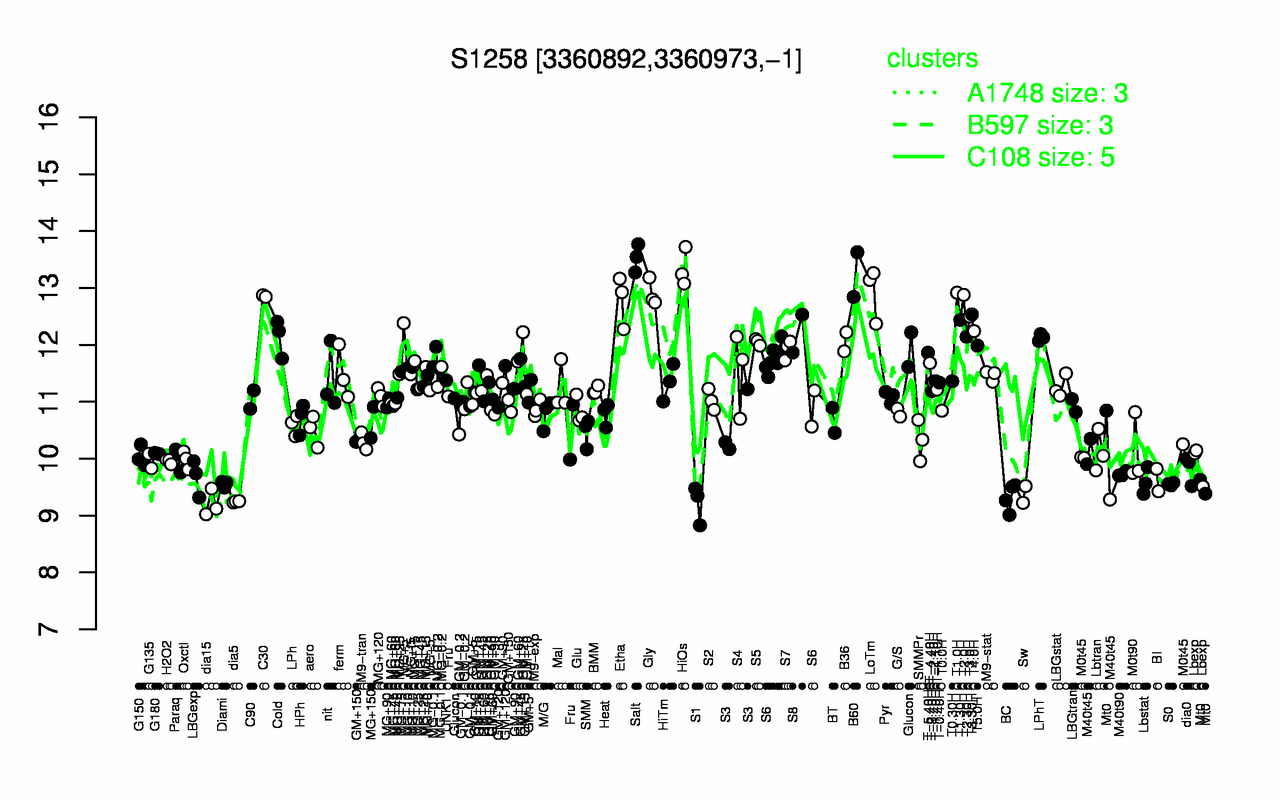
| Salt | HiOs | B60 | LoTm | T1.0H | Gly | T2.0H | C30 | Etha | T3.30H |
| 13.5 | 13.3 | 13.2 | 12.9 | 12.9 | 12.9 | 12.9 | 12.9 | 12.8 | 12.5 |
| dia15 | S1 | dia5 | BC | Sw | S0 | Diami | Lbstat | BI | LBGexp |
| 9.21 | 9.22 | 9.24 | 9.33 | 9.37 | 9.55 | 9.56 | 9.6 | 9.62 | 9.67 |