B. subtilis Expression Data Browser
Start Page
B. subtilis Expression Data Browser
Gene/Segment:
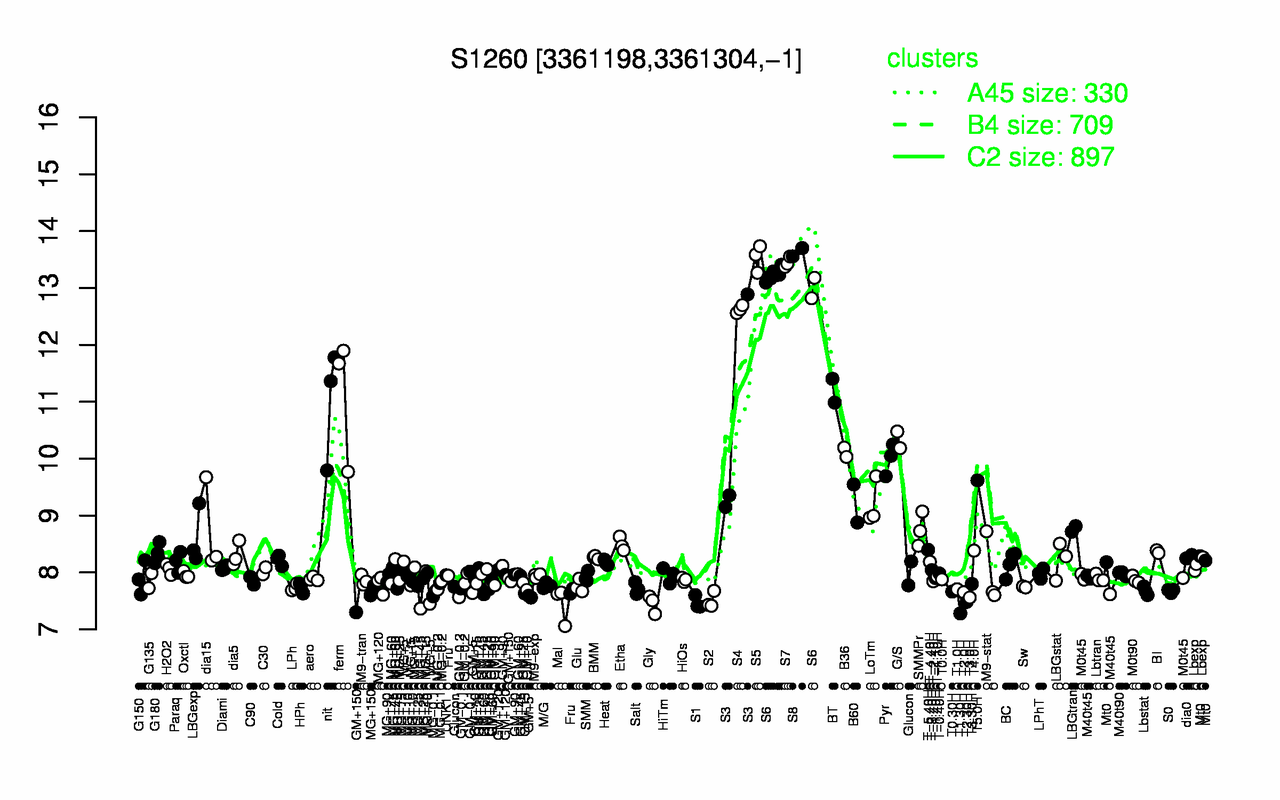
S1260
Locus Tag:
new_3361198_3361304_c
Details about S1260
Show/Hide
Highest Expression Conditions
S8
S5
S7
S6
S4
BT
ferm
nit
S3
G/S
13.6
13.5
13.4
13.2
12.6
11.2
11.1
11
10.5
10.3
Lowest Expression Conditions
T1.30H
Mal
Gly
S1
T2.30H
S2
T3.0H
GM+5
T2.0H
T0.30H
7.28
7.44
7.45
7.47
7.48
7.51
7.56
7.6
7.65
7.66
Most Positively Correlated Segments
yurZ
yveA
ypeB
sleB
ydfR
gdh
S701
yoaR
ykoS
ykzD
0.99
0.98
0.98
0.98
0.97
0.97
0.97
0.97
0.97
0.97
Most Negatively Correlated Segments
yeaC
yugH
yugG
addA
yabJ
yeeC
bceR
ykuH
addB
pbpD
-0.85
-0.84
-0.84
-0.84
-0.84
-0.84
-0.84
-0.83
-0.83
-0.83
Expression Profile of Segment S1260
Show/Hide
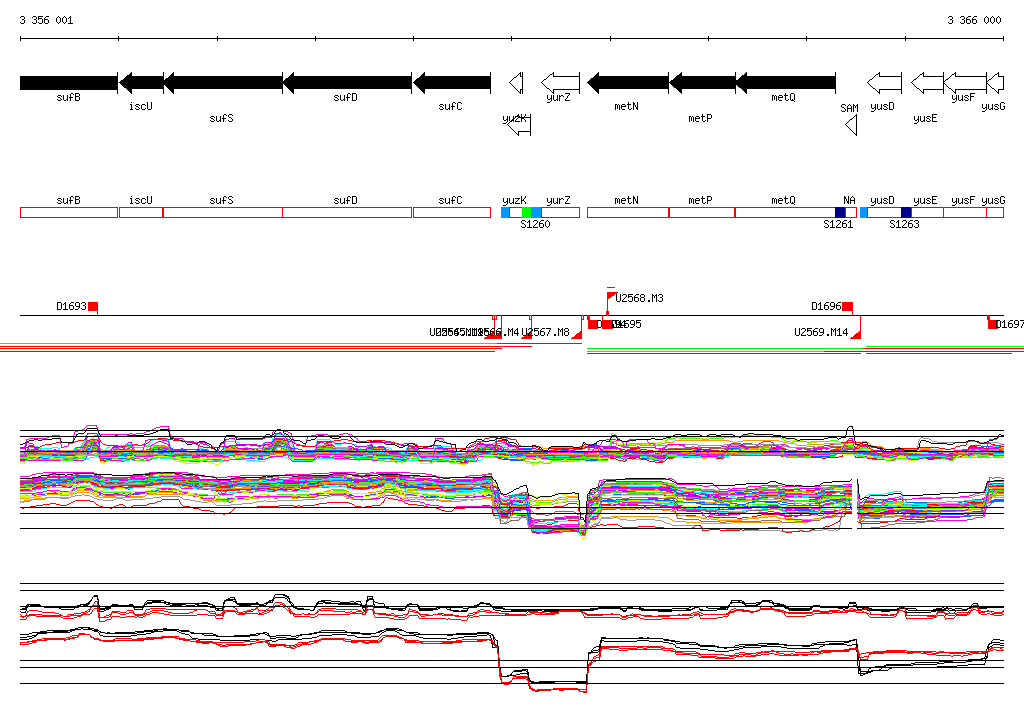
Genomic View of Gene/Segment S1260
Show/Hide
(Legend)
Browse Genome Context