| Start Page |
|
 |
| Start Page |
|
|
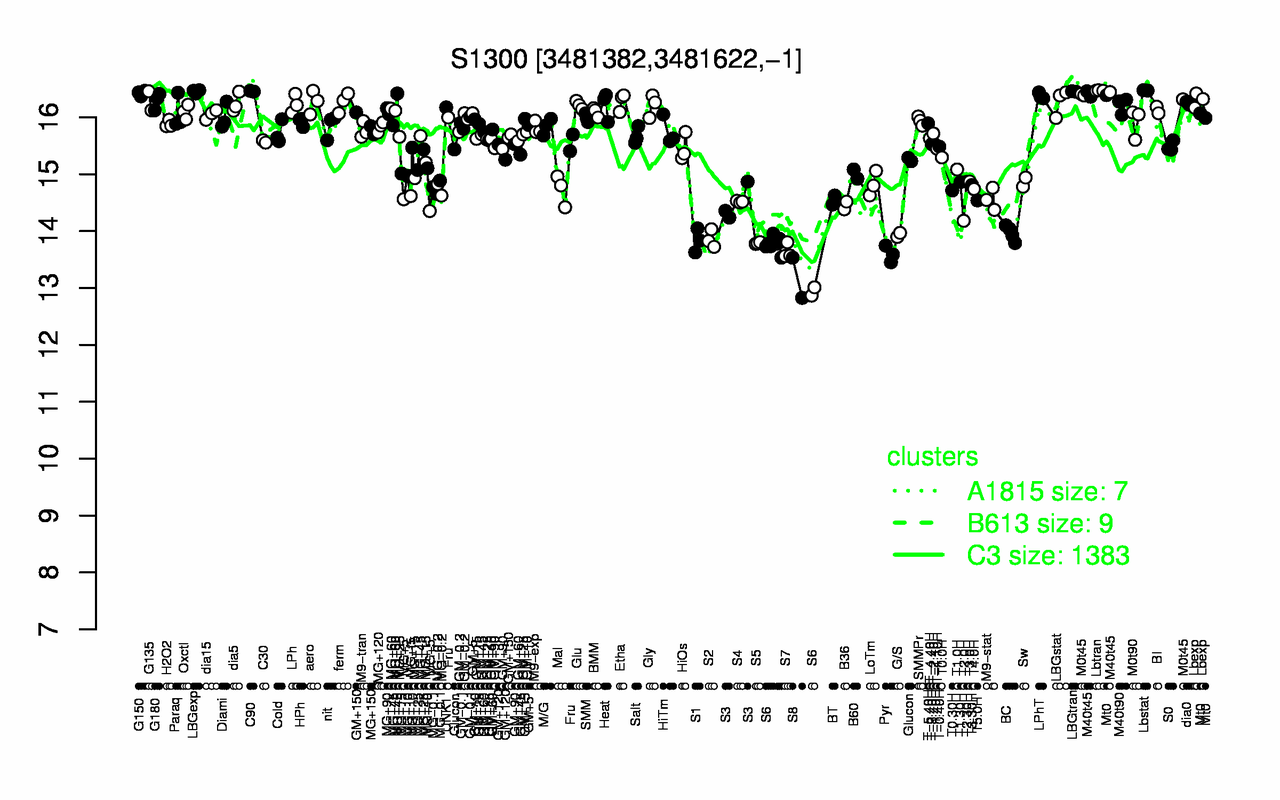
| Lbstat | Lbtran | C90 | LBGtran | LBGexp | G150 | M40t45 | LPhT | M0t45 | Lbexp |
| 16.5 | 16.5 | 16.5 | 16.5 | 16.5 | 16.4 | 16.4 | 16.4 | 16.4 | 16.3 |
| S8 | S6 | Pyr | S7 | S5 | S1 | S2 | G/S | BC | T2.0H |
| 13.2 | 13.6 | 13.6 | 13.6 | 13.8 | 13.8 | 13.9 | 13.9 | 14 | 14.2 |