B. subtilis Expression Data Browser
Start Page
B. subtilis Expression Data Browser
Gene/Segment:
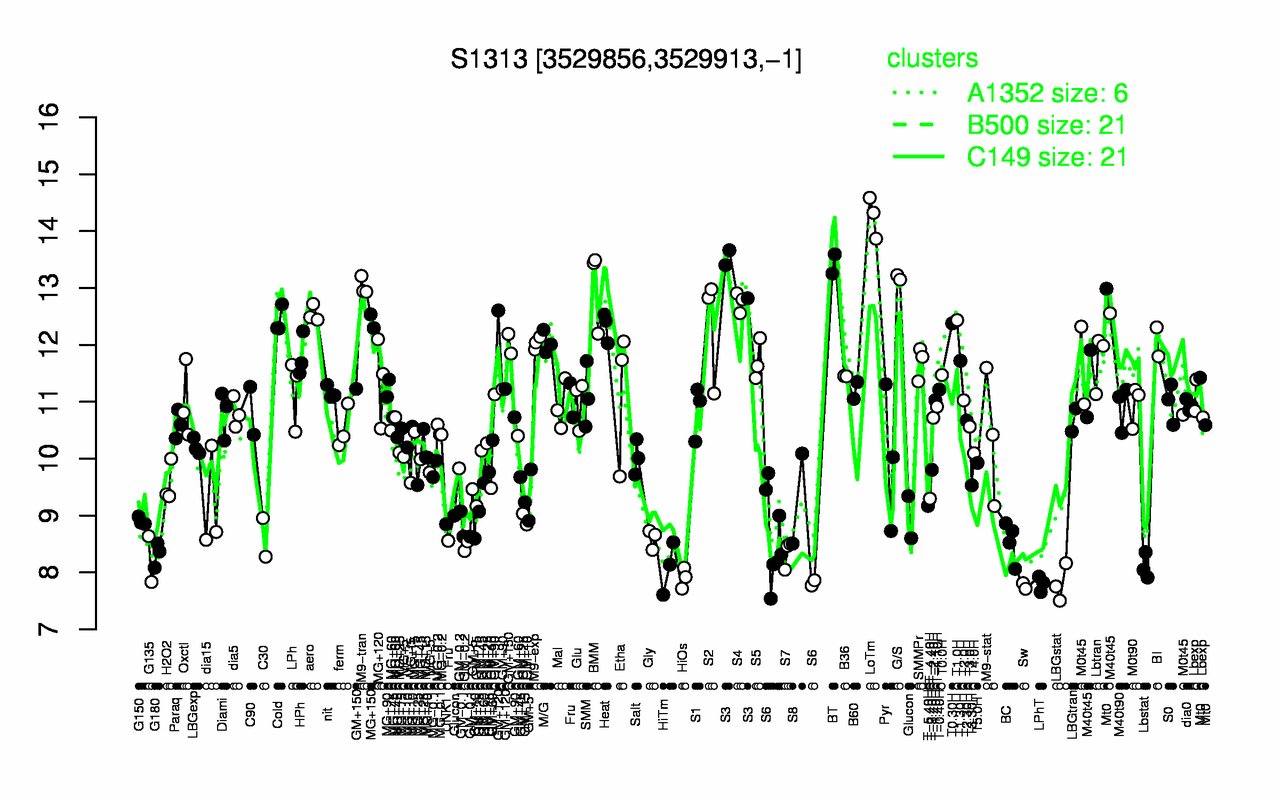
S1313
Locus Tag:
new_3529856_3529913_c
Details about S1313
Show/Hide
Highest Expression Conditions
LoTm
BT
S3
G/S
BMM
M9-tran
S4
aero
T1.0H
Cold
14.3
13.4
13.3
13.2
13
13
12.8
12.5
12.4
12.4
Lowest Expression Conditions
Sw
LPhT
LBGstat
HiOs
HiTm
Lbstat
G135
G180
S7
S6
7.76
7.8
7.81
7.91
8.09
8.1
8.24
8.32
8.34
8.45
Most Positively Correlated Segments
epsA
epsB
sipW
yqxM
epsO
epsE
epsN
epsF
epsD
tasA
0.95
0.93
0.89
0.87
0.85
0.85
0.85
0.84
0.84
0.84
Most Negatively Correlated Segments
yczG
yrzO
yoaZ
pbpA
S481
yfhP
S524
ydaO
murAA
S1572
-0.49
-0.48
-0.47
-0.47
-0.47
-0.46
-0.45
-0.44
-0.44
-0.44
Expression Profile of Segment S1313
Show/Hide
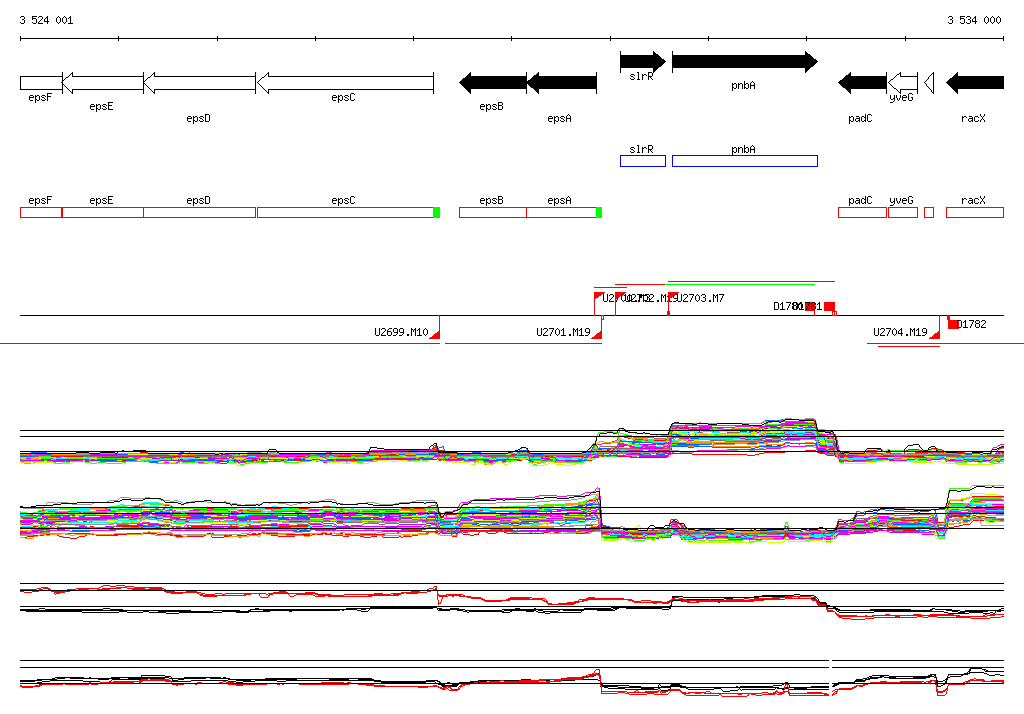
Genomic View of Gene/Segment S1313
Show/Hide
(Legend)
Browse Genome Context