| Start Page |
|
 |
| Start Page |
|
|
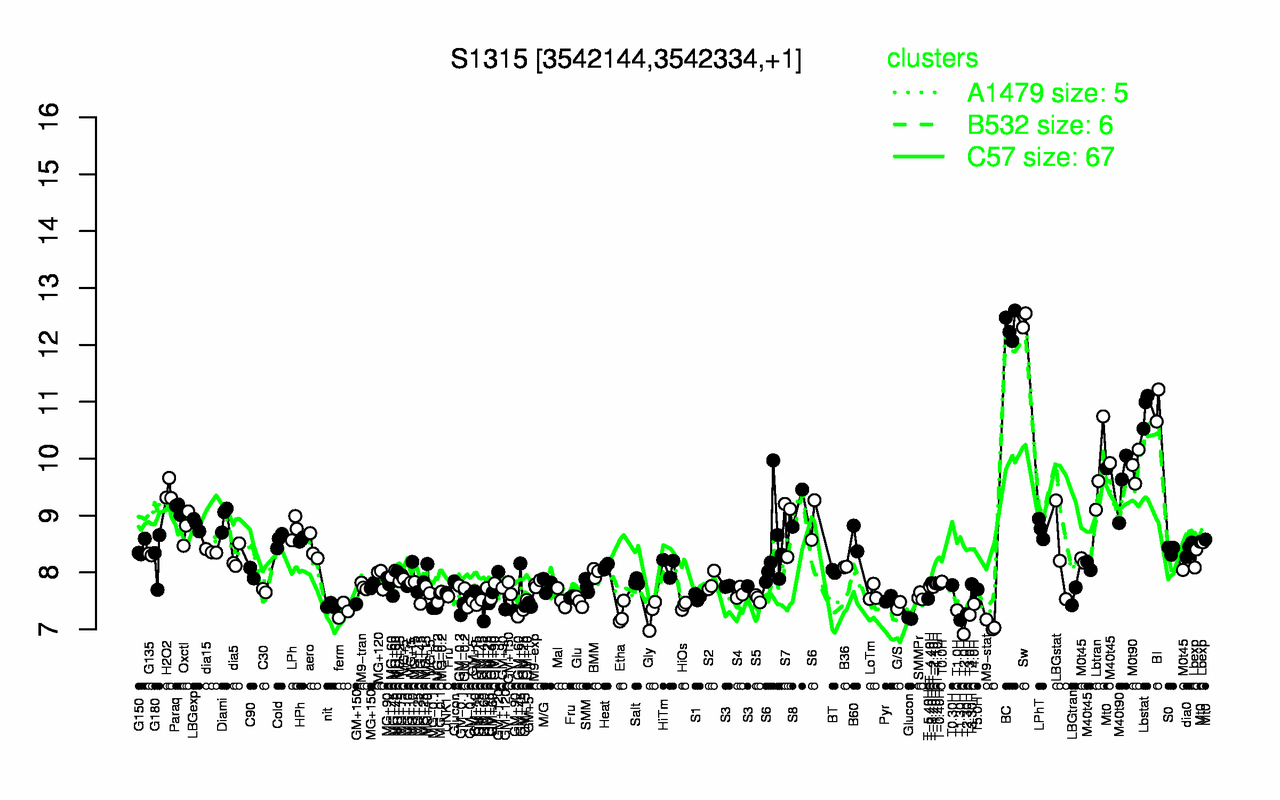
| Sw | BC | BI | Lbstat | M0t90 | Lbtran | M40t90 | H2O2 | S8 | Paraq |
| 12.4 | 12.3 | 10.9 | 10.9 | 9.87 | 9.82 | 9.52 | 9.43 | 9.13 | 9.13 |
| T2.0H | M9-stat | T1.30H | T3.0H | Gly | T2.30H | Etha | ferm | T1.0H | GM+60 |
| 6.91 | 7.07 | 7.17 | 7.26 | 7.27 | 7.27 | 7.28 | 7.33 | 7.34 | 7.34 |