| Start Page |
|
 |
| Start Page |
|
|
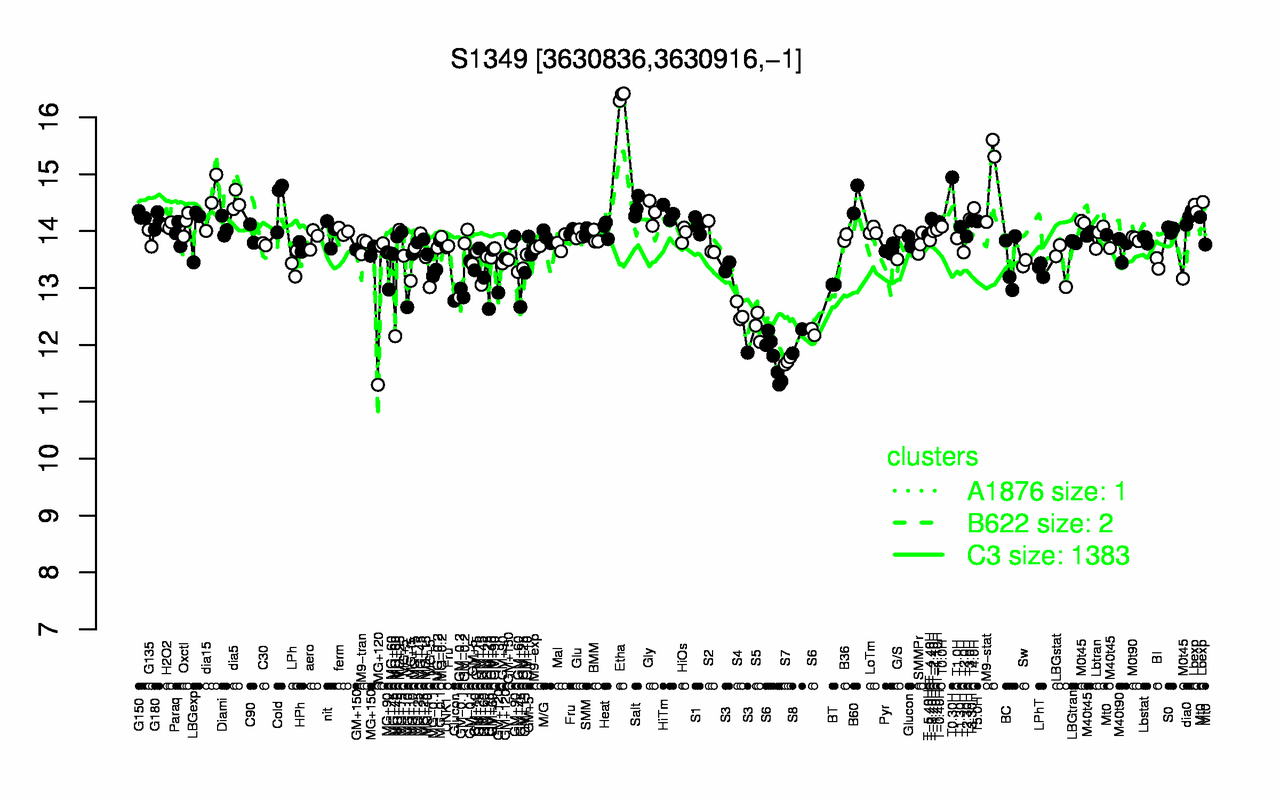
| Etha | M9-stat | T0.30H | B60 | dia5 | Cold | dia15 | Lbexp | Salt | T4.0H |
| 16.4 | 15 | 14.9 | 14.6 | 14.5 | 14.5 | 14.5 | 14.4 | 14.4 | 14.4 |
| S7 | S6 | S8 | S5 | S4 | S3 | MG+60 | MG+120 | BT | GM+45 |
| 11.7 | 11.9 | 12.1 | 12.3 | 12.6 | 12.9 | 12.9 | 12.9 | 13.1 | 13.1 |