B. subtilis Expression Data Browser
Start Page
B. subtilis Expression Data Browser
Gene/Segment:
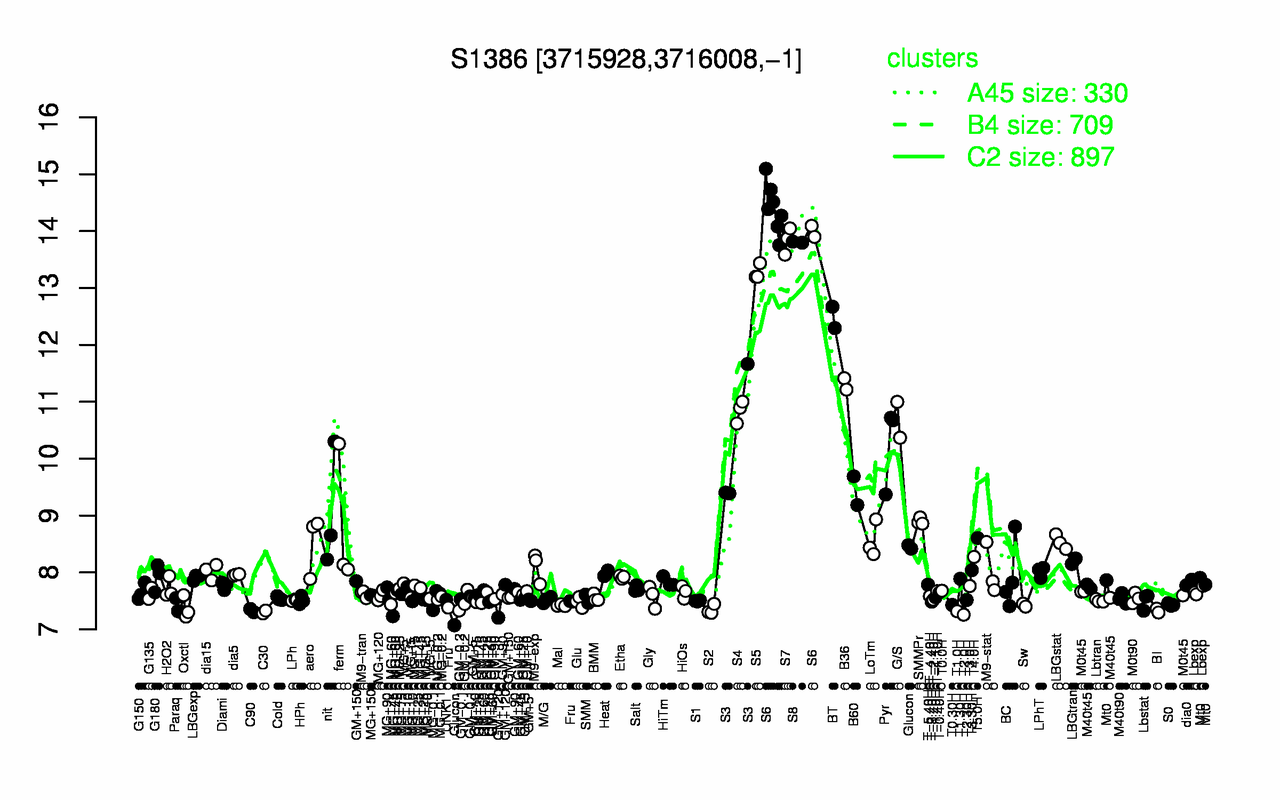
S1386
Locus Tag:
new_3715928_3716008_c
Details about S1386
Show/Hide
Highest Expression Conditions
S6
S7
S8
S5
BT
B36
S4
G/S
Pyr
S3
14.3
13.8
13.8
13.3
12.5
11.3
10.8
10.7
10.3
10.2
Lowest Expression Conditions
T2.0H
C30
T1.0H
C90
BI
S2
Oxctl
Paraq
Mal
Sw
7.26
7.3
7.32
7.33
7.33
7.35
7.37
7.39
7.42
7.42
Most Positively Correlated Segments
cotH
S1387
ykoP
yhjR
ywrJ
cotB
yppG
ytdA
cotP
ydgA
1
0.98
0.98
0.98
0.98
0.97
0.97
0.97
0.97
0.97
Most Negatively Correlated Segments
yeaC
pbpD
ykuH
S1355
bceR
yviA
S511
ptkA
bceS
yugH
-0.88
-0.87
-0.87
-0.87
-0.87
-0.86
-0.86
-0.86
-0.86
-0.86
Expression Profile of Segment S1386
Show/Hide
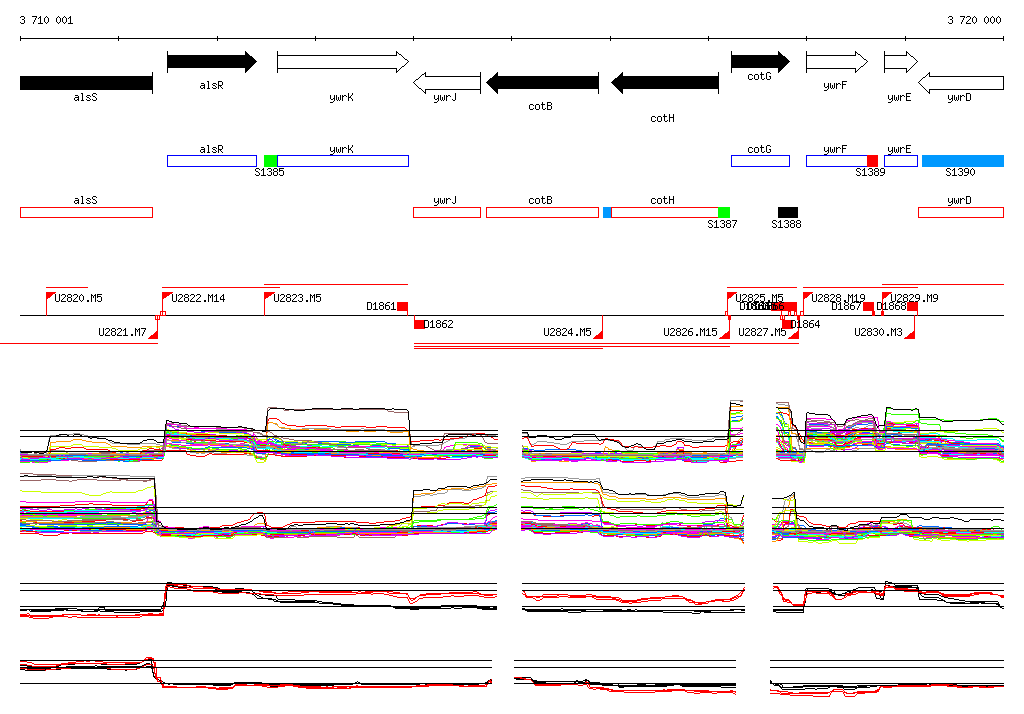
Genomic View of Gene/Segment S1386
Show/Hide
(Legend)
Browse Genome Context