| Start Page |
|
 |
| Start Page |
|
|
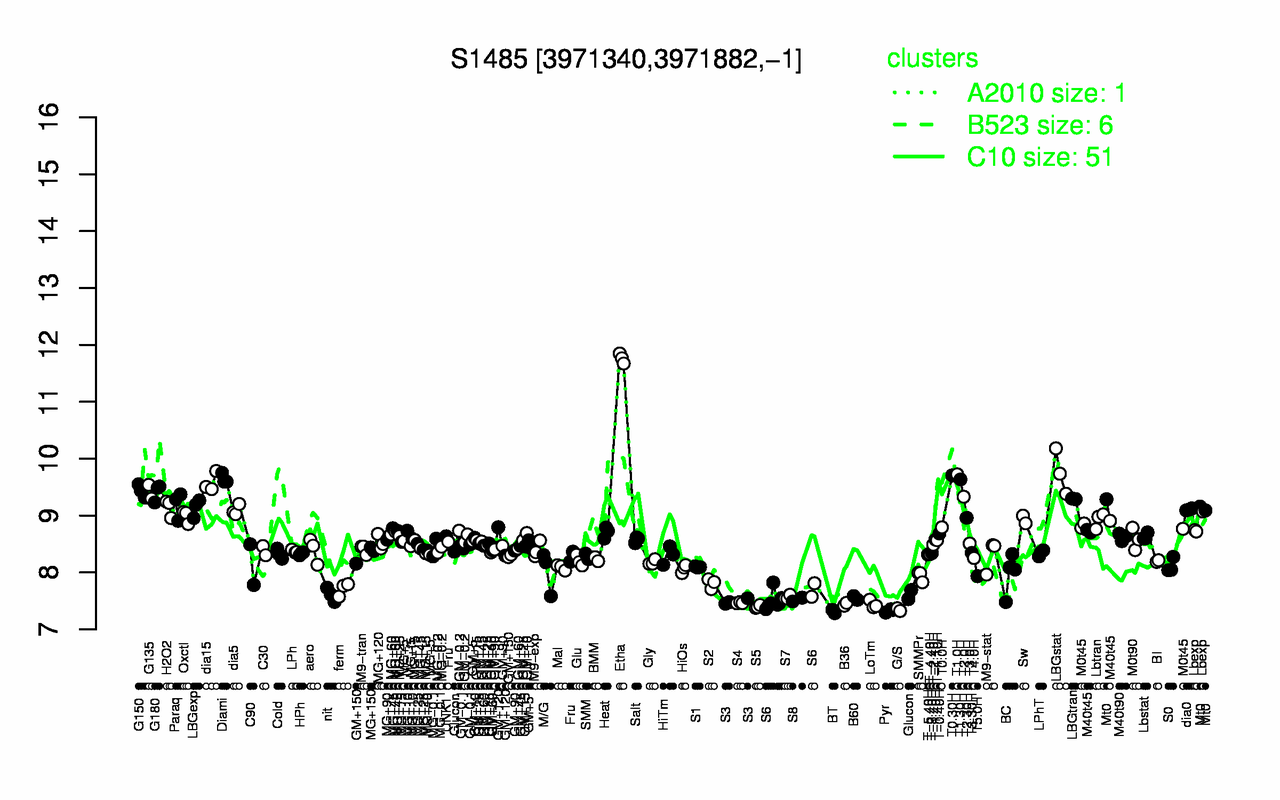
| Etha | LBGstat | T1.0H | T0.30H | Diami | T1.30H | dia15 | G150 | G135 | G180 |
| 11.8 | 9.77 | 9.72 | 9.71 | 9.65 | 9.64 | 9.58 | 9.43 | 9.42 | 9.41 |
| BT | Pyr | G/S | S5 | LoTm | B36 | S4 | S3 | S8 | S6 |
| 7.31 | 7.33 | 7.35 | 7.4 | 7.44 | 7.44 | 7.47 | 7.49 | 7.52 | 7.54 |