B. subtilis Expression Data Browser
Start Page
B. subtilis Expression Data Browser
Gene/Segment:
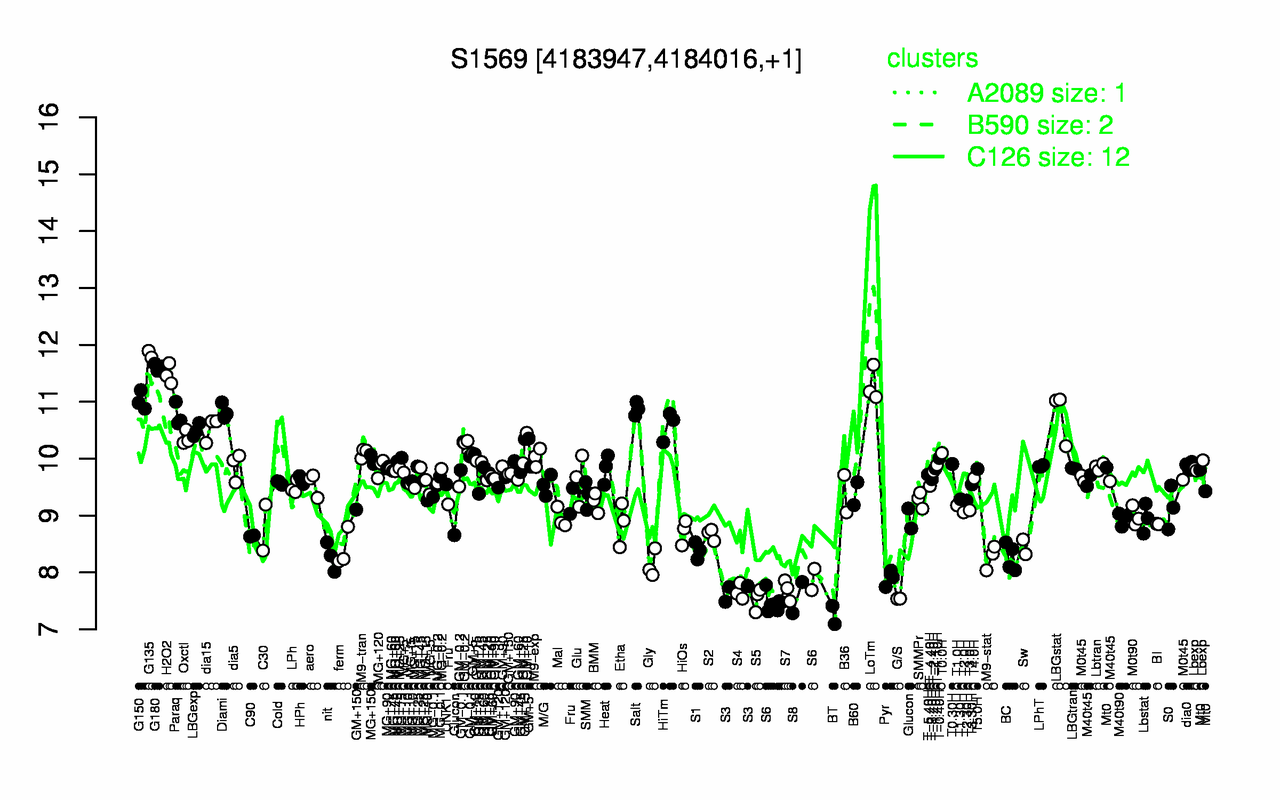
S1569
Locus Tag:
new_4183947_4184016
Details about S1569
Show/Hide
Highest Expression Conditions
G135
G180
H2O2
LoTm
G150
Salt
Diami
Paraq
LBGstat
HiTm
11.8
11.6
11.5
11.3
11
10.9
10.8
10.8
10.8
10.6
Lowest Expression Conditions
BT
S5
G/S
S6
S8
S4
S3
S7
Pyr
Gly
7.25
7.54
7.54
7.56
7.56
7.66
7.66
7.69
7.9
8.14
Most Positively Correlated Segments
mobA
ycgR
trmE
ywgB
S280
S1552
ycgQ
dgk
S1394
mmr
0.81
0.79
0.79
0.79
0.79
0.78
0.78
0.78
0.77
0.77
Most Negatively Correlated Segments
yvaM
phrC
yhzD
S1112
sigF
spoIIAB
S545
ylaJ
mpr
ytpI
-0.73
-0.72
-0.72
-0.71
-0.71
-0.71
-0.7
-0.7
-0.7
-0.7
Expression Profile of Segment S1569
Show/Hide
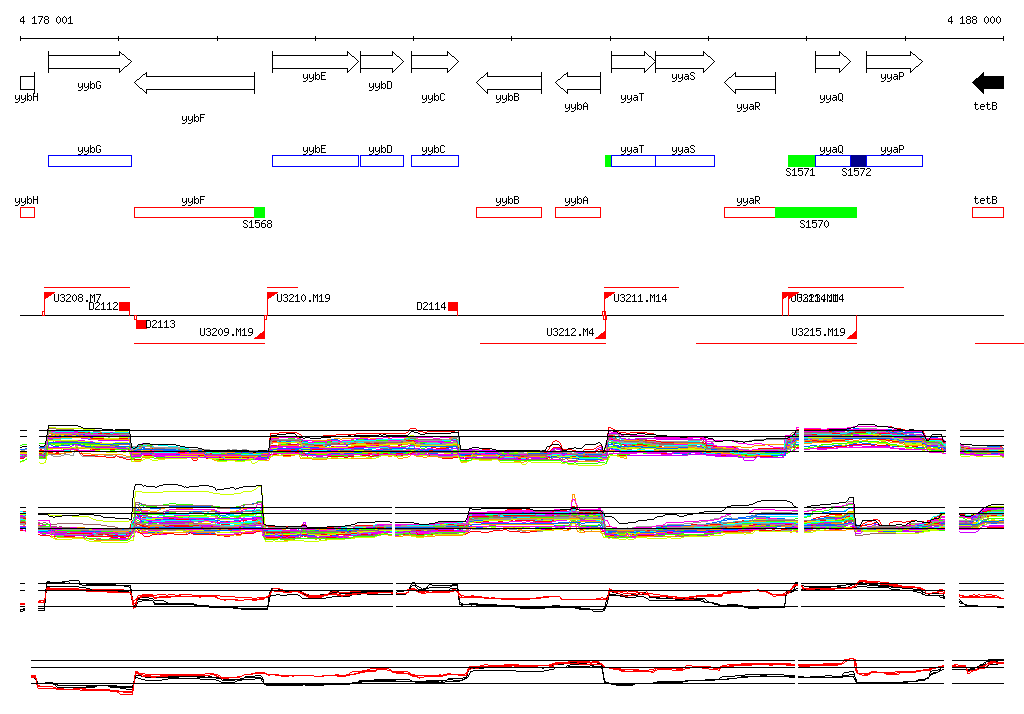
Genomic View of Gene/Segment S1569
Show/Hide
(Legend)
Browse Genome Context