B. subtilis Expression Data Browser
Start Page
B. subtilis Expression Data Browser
Gene/Segment:
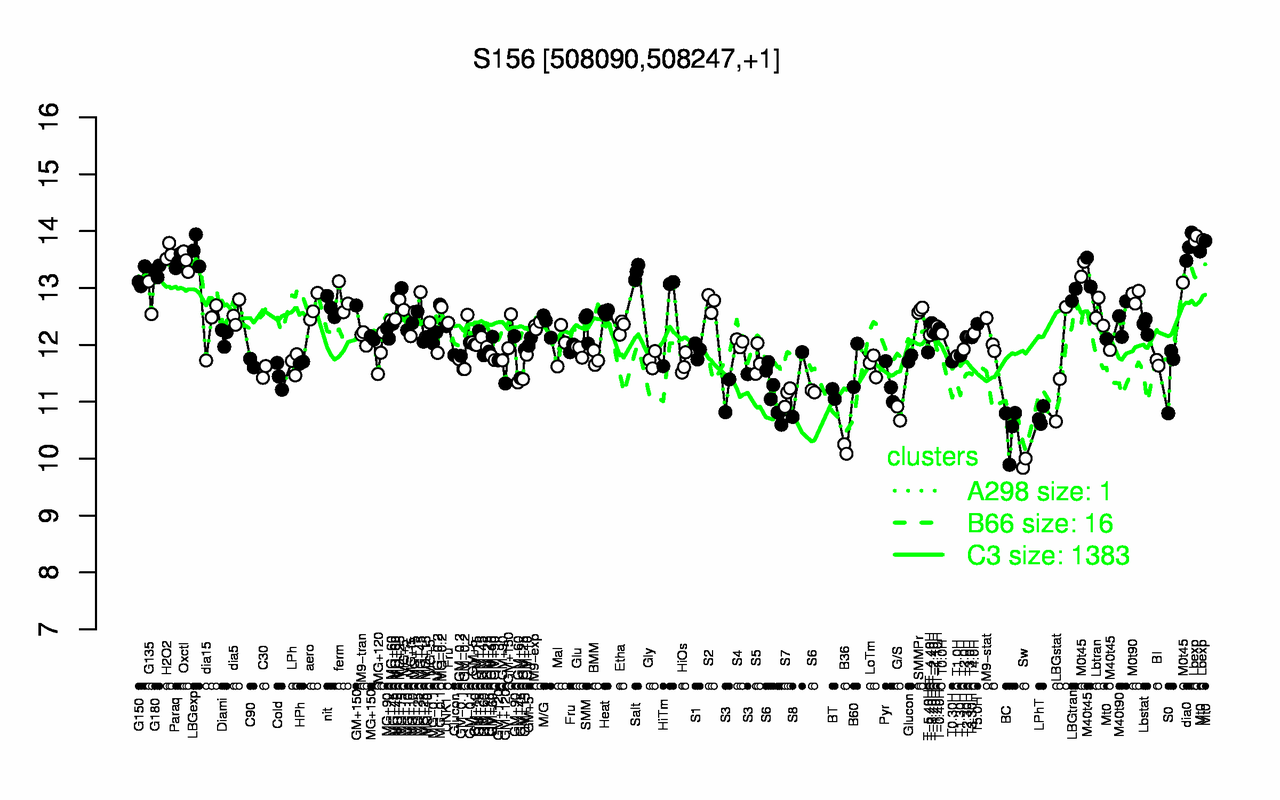
S156
Locus Tag:
new_508090_508247
Details about S156
Show/Hide
Highest Expression Conditions
Lbexp
dia0
LBGexp
H2O2
Paraq
Oxctl
G180
Salt
M0t45
Mt0
13.9
13.7
13.7
13.6
13.5
13.5
13.3
13.3
13.3
13.2
Lowest Expression Conditions
Sw
B36
BC
LPhT
G/S
S7
S6
BT
S3
S8
9.92
10.2
10.5
10.7
10.8
11.1
11.1
11.1
11.2
11.3
Most Positively Correlated Segments
S955
S85
S84
ydzO
oatA
ybfF
ydeS
S527
yjbL
S672
0.74
0.73
0.72
0.71
0.71
0.71
0.71
0.71
0.7
0.68
Most Negatively Correlated Segments
NA
ybfJ
ytzI
S978
yhzC
S717
mpr
ynfC
phrA
yhdT
-0.66
-0.64
-0.64
-0.63
-0.63
-0.63
-0.62
-0.62
-0.62
-0.62
Expression Profile of Segment S156
Show/Hide
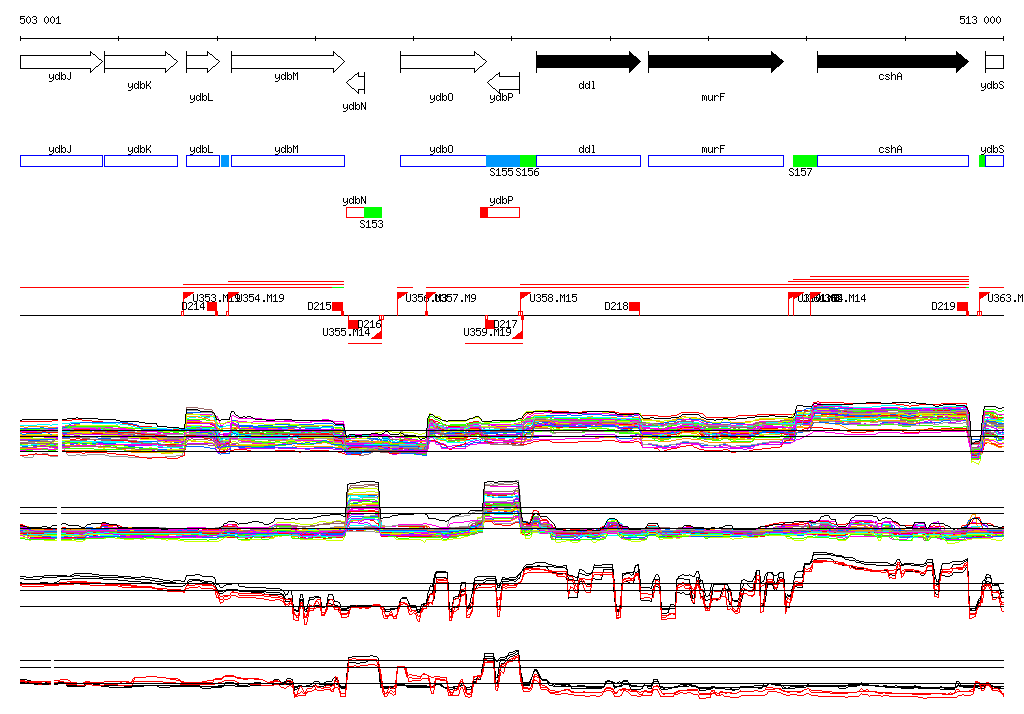
Genomic View of Gene/Segment S156
Show/Hide
(Legend)
Browse Genome Context