| Start Page |
|
 |
| Start Page |
|
|
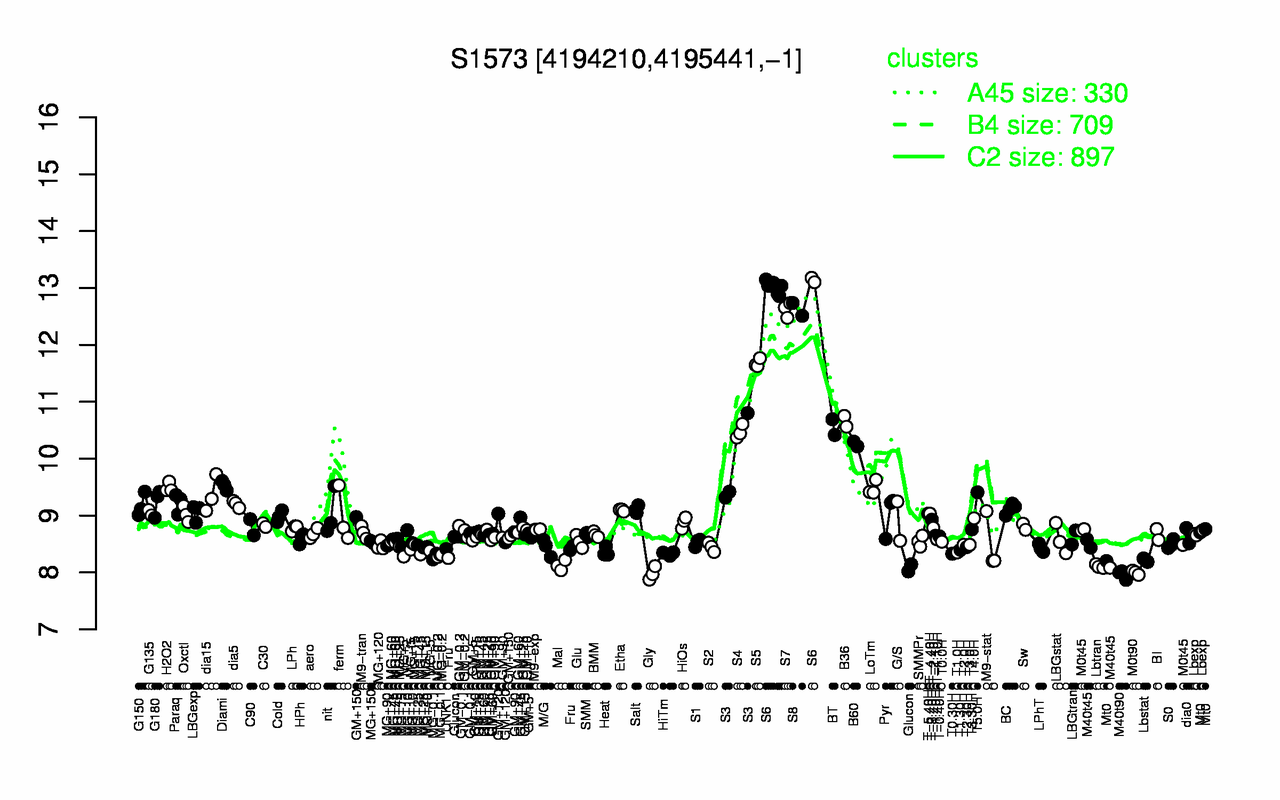
| S6 | S8 | S7 | S5 | B36 | BT | S4 | B60 | S3 | Diami |
| 13 | 12.6 | 12.6 | 11.7 | 10.7 | 10.6 | 10.5 | 10.3 | 9.85 | 9.53 |
| M40t90 | Gly | M0t90 | Lbtran | Mal | Lbstat | Glucon | MG-0.1 | MG-0.2 | T0.30H |
| 7.96 | 7.98 | 8 | 8.11 | 8.13 | 8.21 | 8.26 | 8.29 | 8.29 | 8.33 |