B. subtilis Expression Data Browser
Start Page
B. subtilis Expression Data Browser
Gene/Segment:
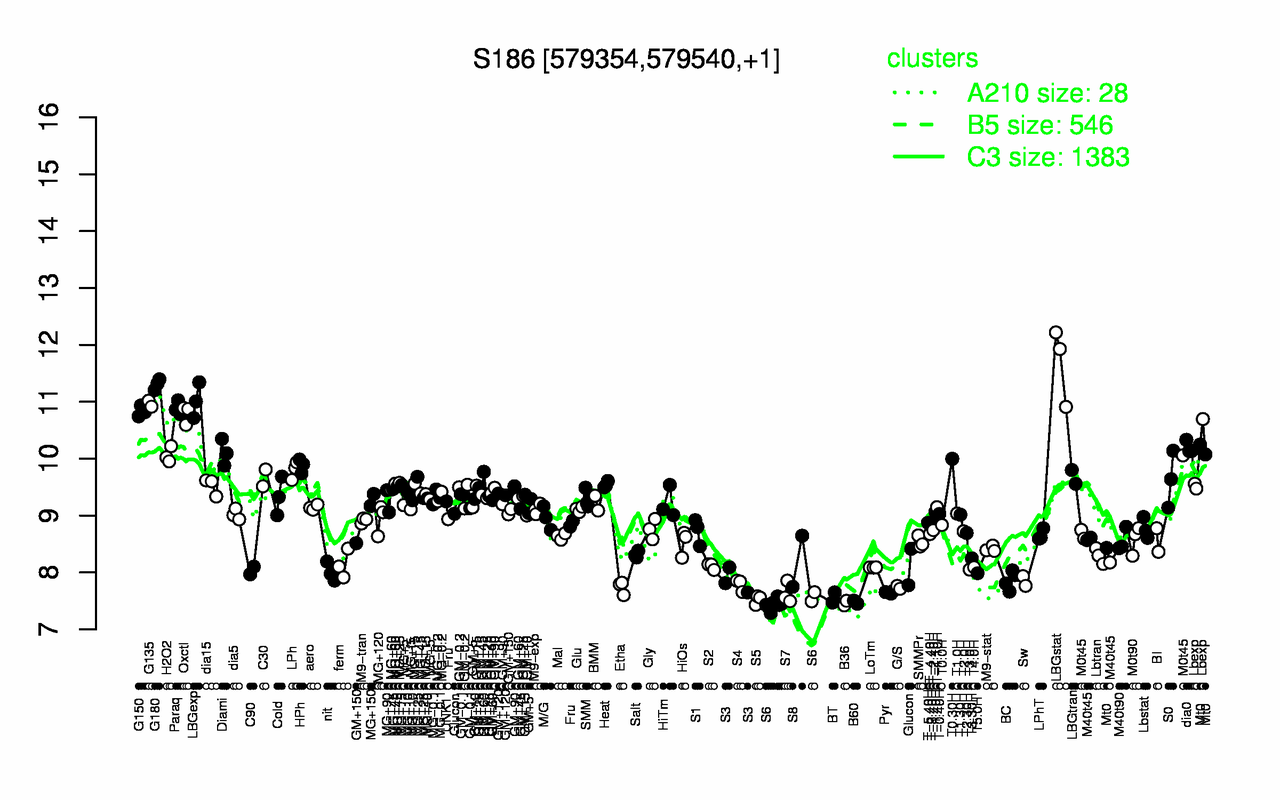
S186
Locus Tag:
new_579354_579540
Details about S186
Show/Hide
Highest Expression Conditions
LBGstat
G180
LBGexp
G135
Paraq
G150
Oxctl
dia0
Diami
H2O2
11.7
11.3
11
11
10.9
10.8
10.8
10.2
10.1
10.1
Lowest Expression Conditions
B36
S6
B60
S5
BT
S7
Pyr
G/S
Etha
S4
7.46
7.46
7.48
7.52
7.56
7.64
7.65
7.74
7.74
7.78
Most Positively Correlated Segments
aseR
ydfA
ydzS
ydzS
S395
yetN
mmr
yrrM
yybC
yxaF
0.99
0.95
0.95
0.95
0.91
0.88
0.88
0.88
0.88
0.87
Most Negatively Correlated Segments
mpr
spoIIAA
spoIIAB
ymzB
sigF
dat
ybfJ
phrC
yjcG
yhzC
-0.82
-0.82
-0.81
-0.81
-0.81
-0.8
-0.8
-0.78
-0.78
-0.77
Expression Profile of Segment S186
Show/Hide
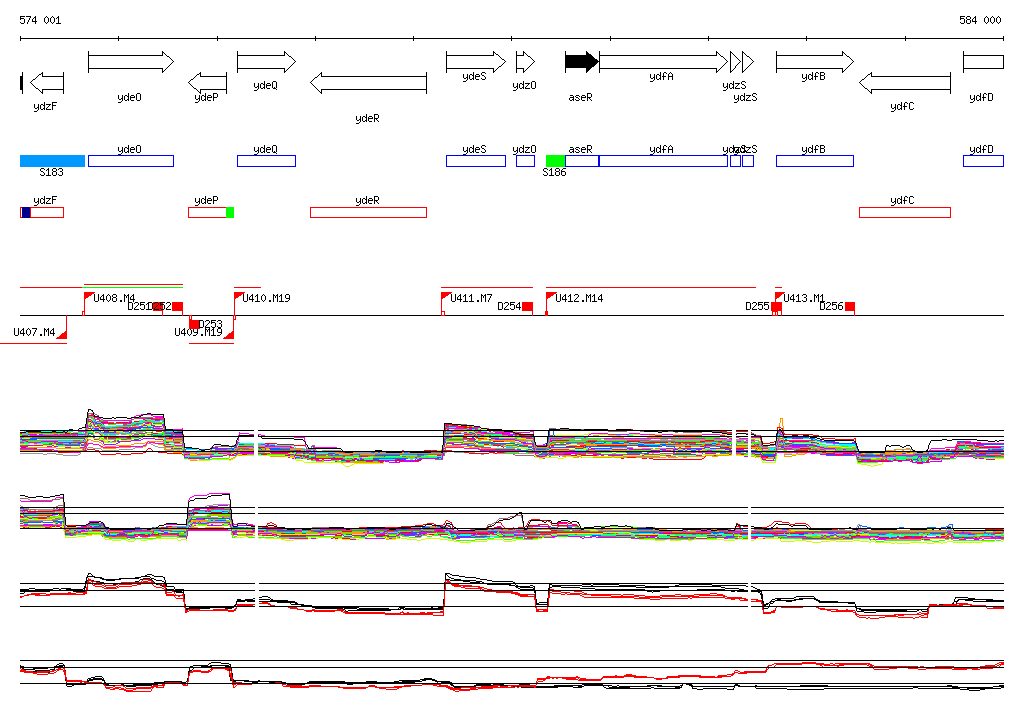
Genomic View of Gene/Segment S186
Show/Hide
(Legend)
Browse Genome Context