| Start Page |
|
 |
| Start Page |
|
|
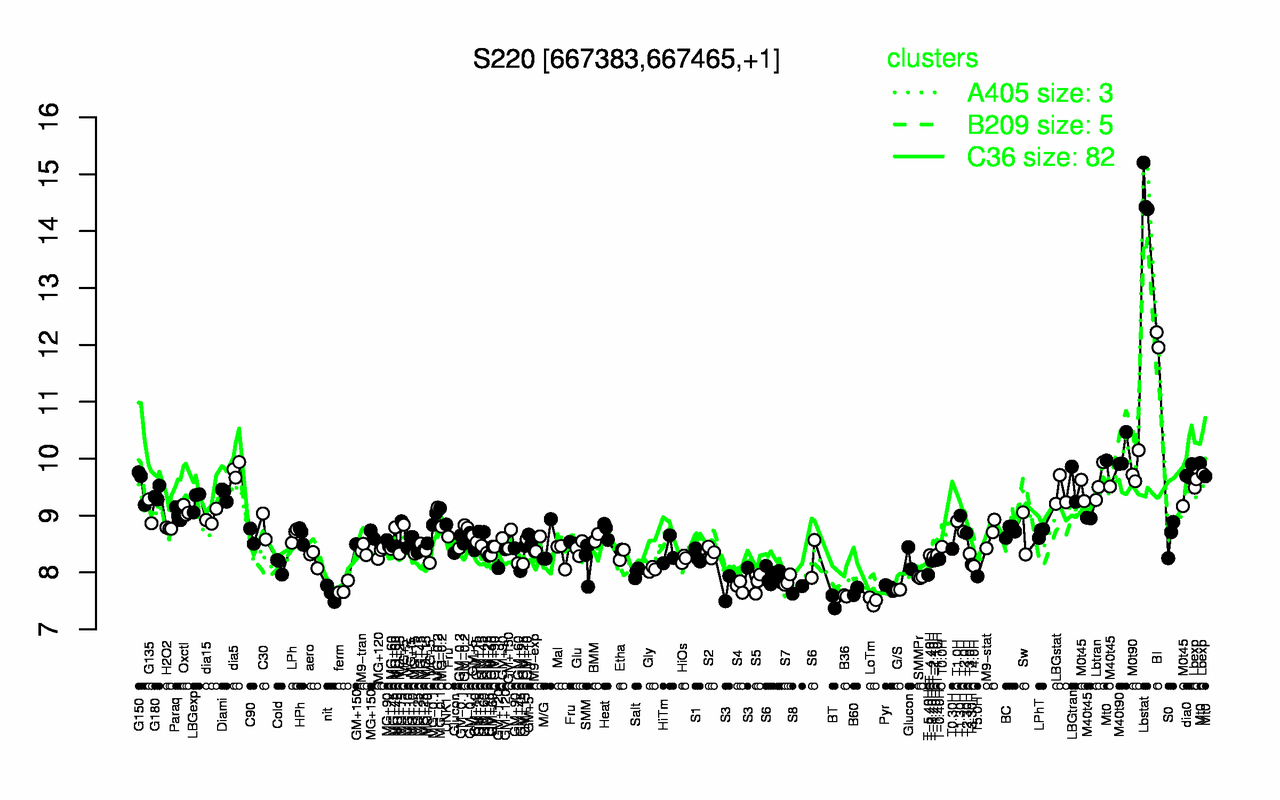
| Lbstat | BI | M40t90 | Mt0 | M0t90 | dia5 | dia0 | Lbexp | Lbtran | LBGtran |
| 14.7 | 12.1 | 10.1 | 9.86 | 9.82 | 9.81 | 9.76 | 9.62 | 9.57 | 9.55 |
| BT | LoTm | B36 | nit | B60 | S8 | G/S | ferm | Pyr | S4 |
| 7.48 | 7.5 | 7.59 | 7.63 | 7.67 | 7.69 | 7.7 | 7.72 | 7.73 | 7.75 |