B. subtilis Expression Data Browser
Details about S257 Show/Hide
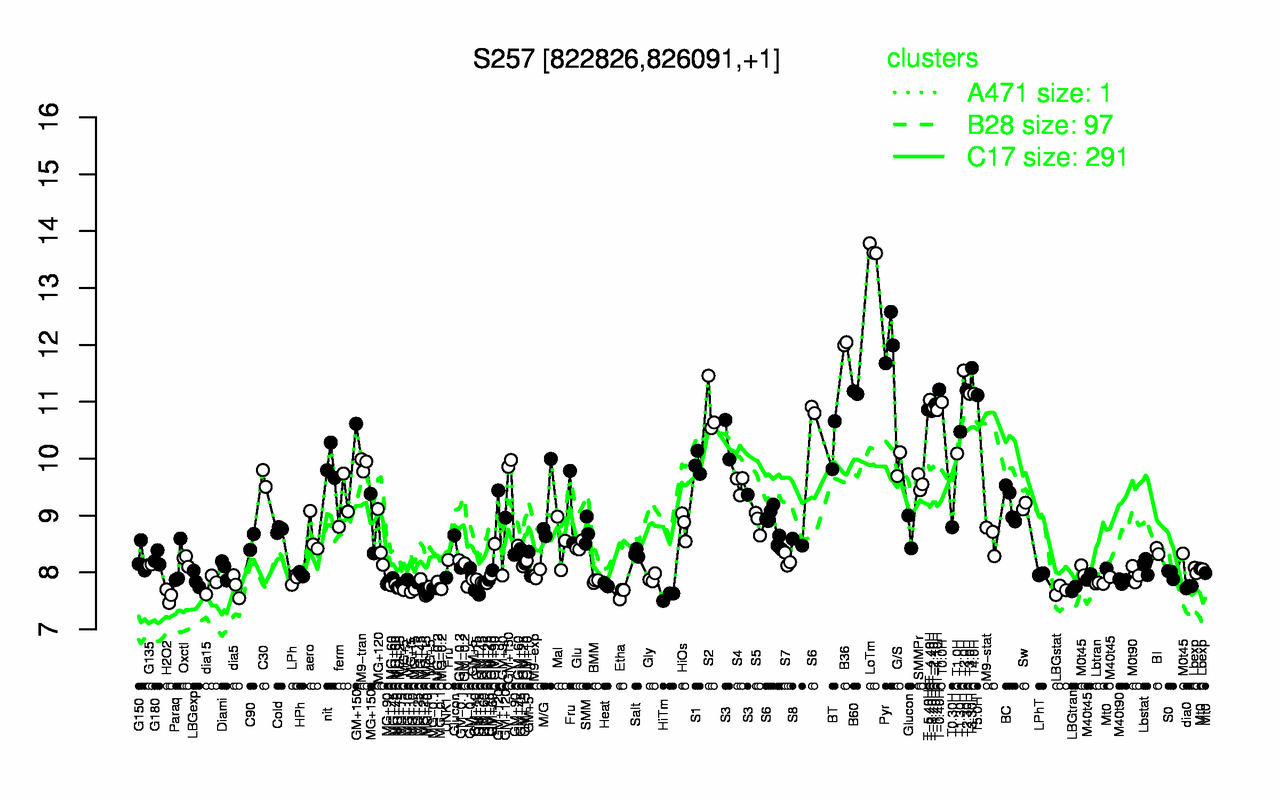
Highest Expression Conditions
LoTm Pyr B36 T3.30H T2.0H T-0.40H T2.30H B60 T4.0H T3.0H
13.7 12.1 12 11.6 11.5 11.2 11.2 11.2 11.1 11.1
Lowest Expression Conditions
HiTm H2O2 Etha MG+t5 LBGstat MG+15 LBGtran MG+5 MG-0.1 dia0
7.59 7.59 7.64 7.66 7.69 7.7 7.71 7.72 7.72 7.75
Most Positively Correlated Segments
S256 skfH skfC skfG skfF S78 skfB skfE yfmG ydeH
0.84 0.83 0.82 0.82 0.82 0.82 0.81 0.81 0.78 0.77
Most Negatively Correlated Segments
yfmF yncB tetB ywfL pta ywdI ygzD cysL ung yheG
-0.71 -0.69 -0.65 -0.65 -0.64 -0.63 -0.63 -0.62 -0.62 -0.62
Expression Profile of Segment S257 Show/Hide
Genomic View of Gene/Segment S257 Show/Hide
(Legend)