| Start Page |
|
 |
| Start Page |
|
|
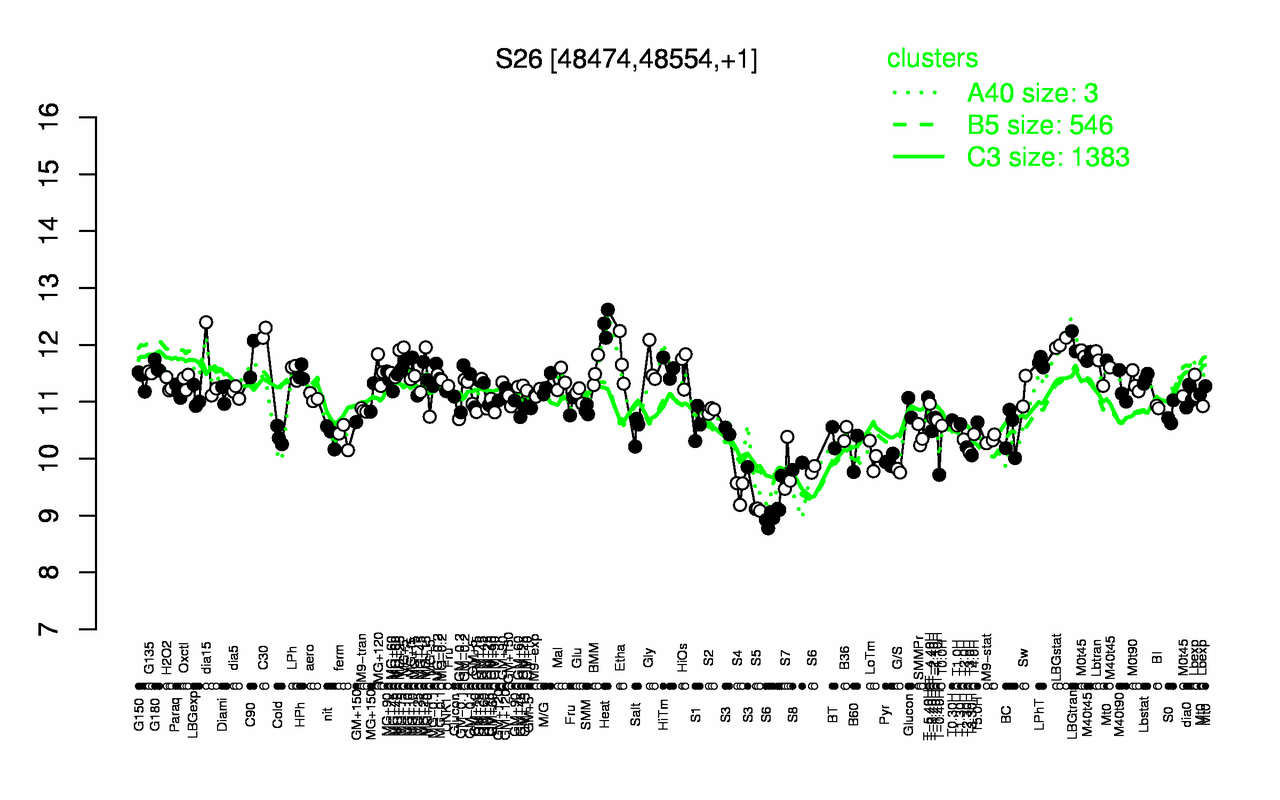
| Heat | C30 | LBGtran | LBGstat | C90 | Etha | M40t45 | LPhT | MG+15 | Gly |
| 12.4 | 12.2 | 12.1 | 12 | 11.7 | 11.7 | 11.7 | 11.7 | 11.7 | 11.7 |
| S5 | S6 | S4 | T-0.40H | G/S | S7 | S8 | Pyr | LoTm | T3.30H |
| 9.11 | 9.25 | 9.44 | 9.72 | 9.79 | 9.82 | 9.87 | 9.97 | 10 | 10.1 |