| Start Page |
|
 |
| Start Page |
|
|
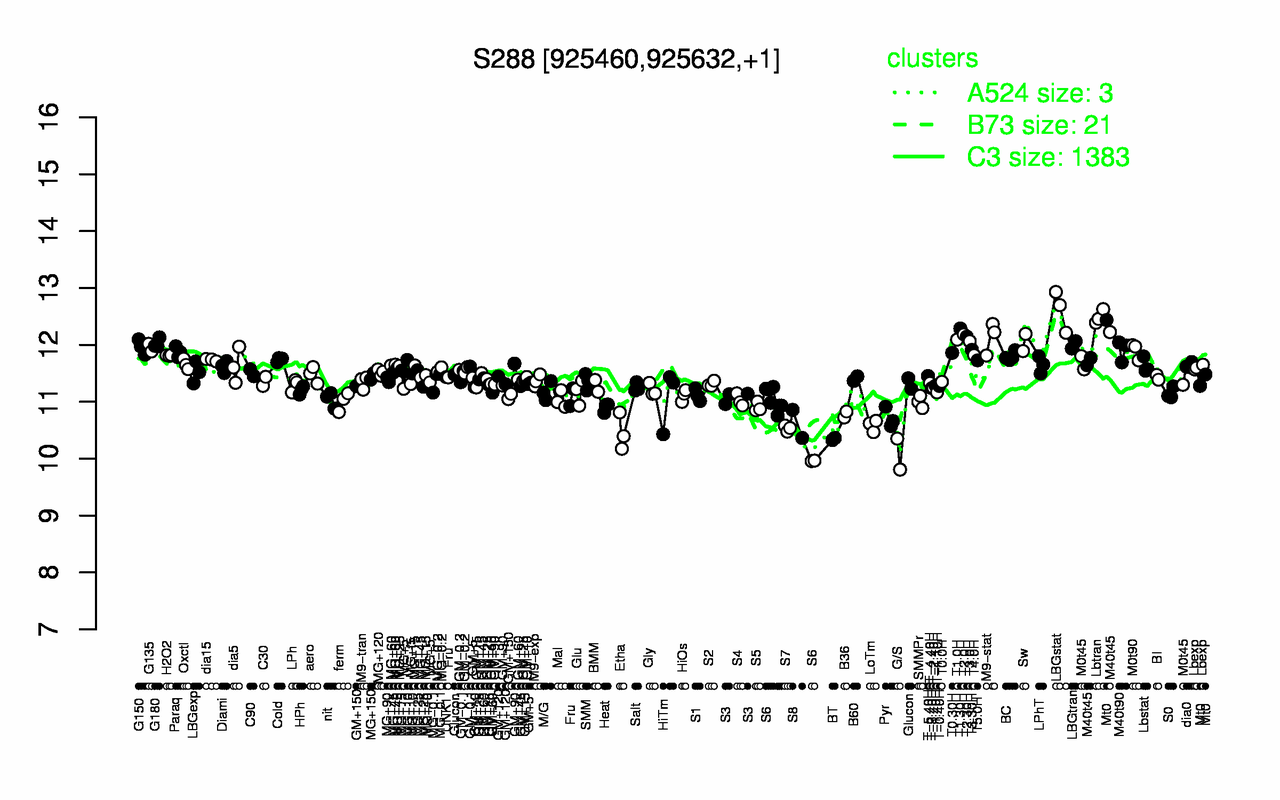
| LBGstat | Lbtran | T1.30H | T2.0H | T2.30H | M9-stat | T1.0H | T3.0H | Sw | G180 |
| 12.6 | 12.5 | 12.3 | 12.2 | 12.1 | 12.1 | 12.1 | 12.1 | 12 | 12 |
| G/S | BT | Etha | S7 | LoTm | S8 | Pyr | B36 | S6 | Heat |
| 10.1 | 10.3 | 10.5 | 10.5 | 10.6 | 10.6 | 10.7 | 10.8 | 10.8 | 10.9 |