| Start Page |
|
 |
| Start Page |
|
|
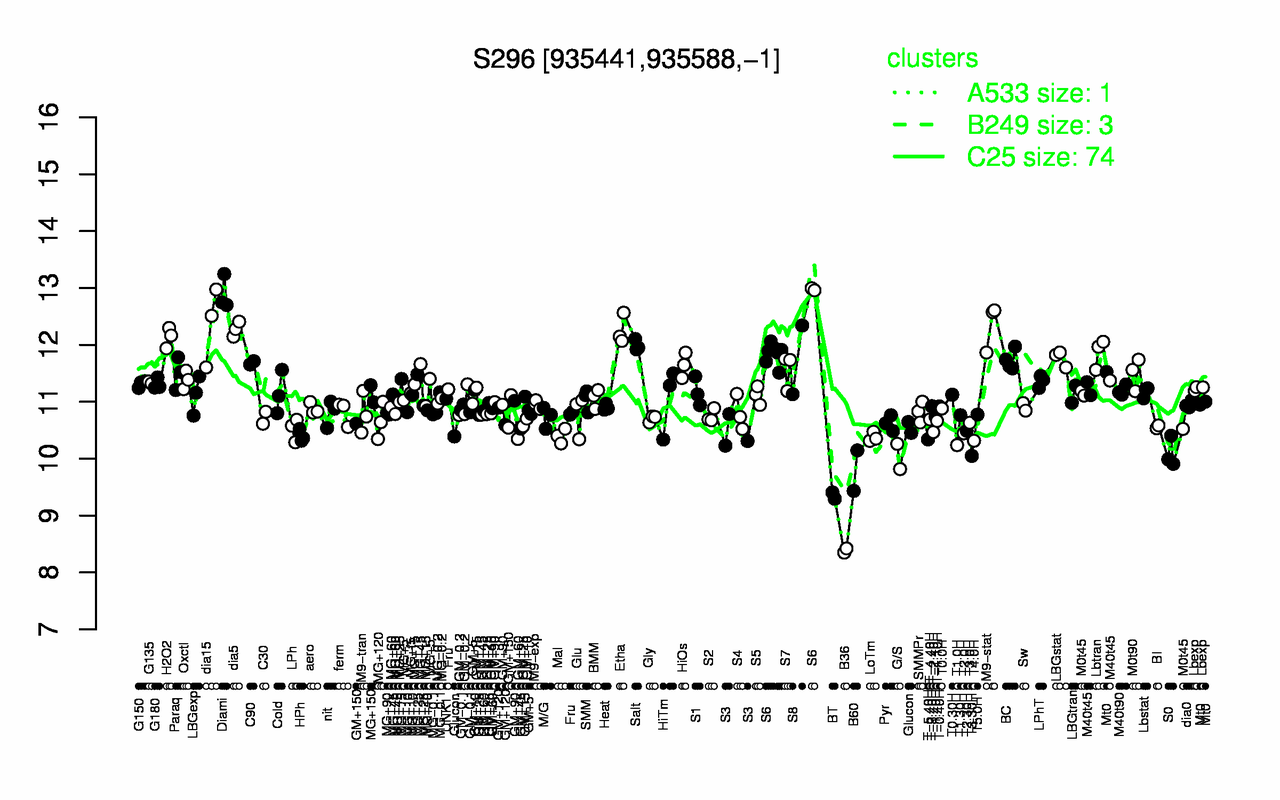
| Diami | dia15 | M9-stat | dia5 | Etha | H2O2 | S6 | Salt | Lbtran | LBGstat |
| 12.9 | 12.4 | 12.3 | 12.3 | 12.3 | 12.1 | 12.1 | 12 | 11.9 | 11.8 |
| B36 | BT | B60 | G/S | T3.30H | S0 | T1.0H | T4.0H | T-5.40H | LoTm |
| 8.38 | 9.35 | 9.79 | 10 | 10 | 10.1 | 10.2 | 10.3 | 10.3 | 10.4 |