| Start Page |
|
 |
| Start Page |
|
|
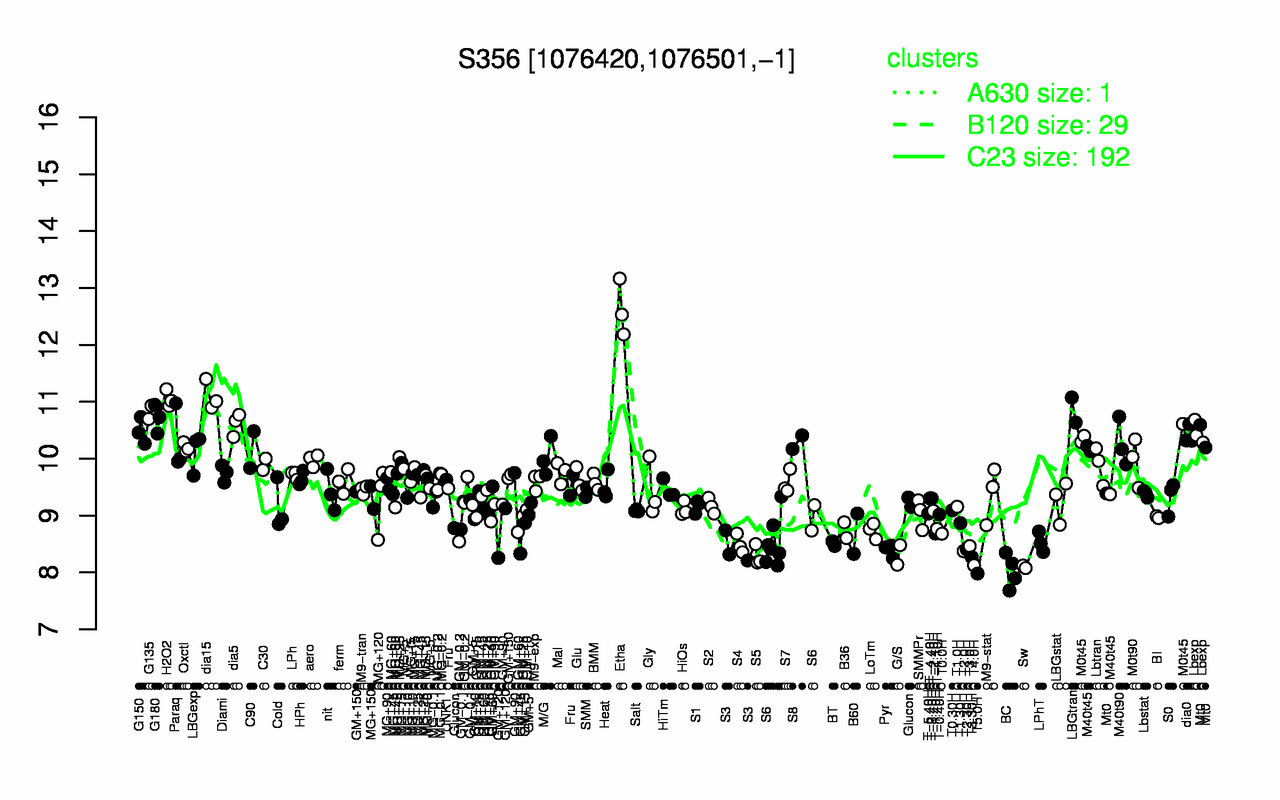
| Etha | dia15 | H2O2 | LBGtran | G135 | G180 | dia5 | G150 | Lbexp | M0t45 |
| 12.6 | 11.1 | 11.1 | 10.9 | 10.8 | 10.7 | 10.6 | 10.5 | 10.5 | 10.4 |
| T5.0H | BC | Sw | T4.0H | T3.30H | S5 | G/S | T2.0H | Pyr | T2.30H |
| 7.98 | 8.02 | 8.1 | 8.13 | 8.27 | 8.29 | 8.31 | 8.37 | 8.39 | 8.4 |