B. subtilis Expression Data Browser
Start Page
B. subtilis Expression Data Browser
Gene/Segment:
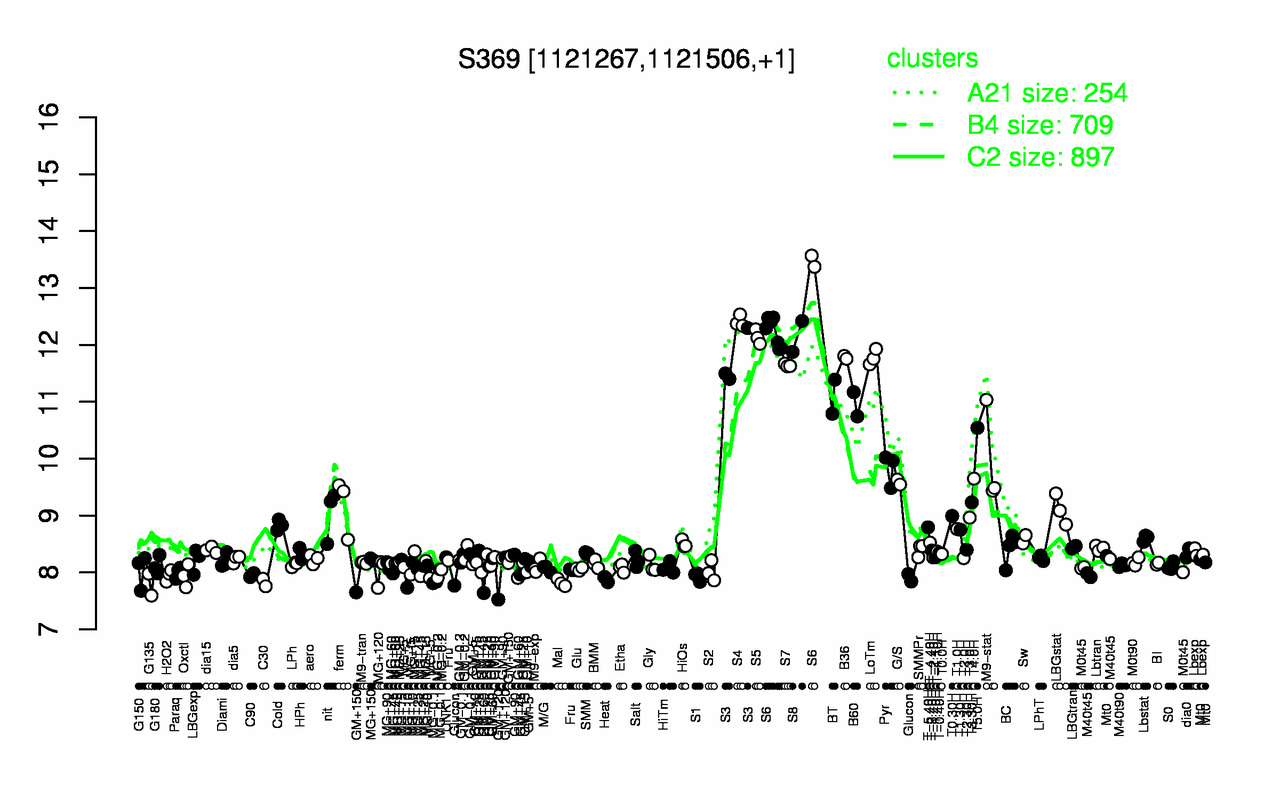
S369
Locus Tag:
new_1121267_1121506
Details about S369
Show/Hide
Highest Expression Conditions
S6
S4
S8
S5
LoTm
B36
S3
S7
BT
B60
12.5
12.4
12.1
12.1
11.8
11.8
11.7
11.6
11.1
11
Lowest Expression Conditions
G135
Mal
C30
Glucon
Heat
GM+120
MG-0.1
S1
GM+60
Oxctl
7.79
7.82
7.82
7.86
7.88
7.89
7.9
7.93
7.93
7.94
Most Positively Correlated Segments
S1445
S1062
glnP
yoyB
alrB
yodP
yodQ
glnM
S738
S1550
0.97
0.96
0.96
0.96
0.96
0.96
0.96
0.96
0.96
0.96
Most Negatively Correlated Segments
S378
sbcD
yugH
ywfO
sbcC
addA
yugG
yvrG
ywgA
addB
-0.91
-0.91
-0.9
-0.89
-0.88
-0.88
-0.88
-0.87
-0.87
-0.87
Expression Profile of Segment S369
Show/Hide
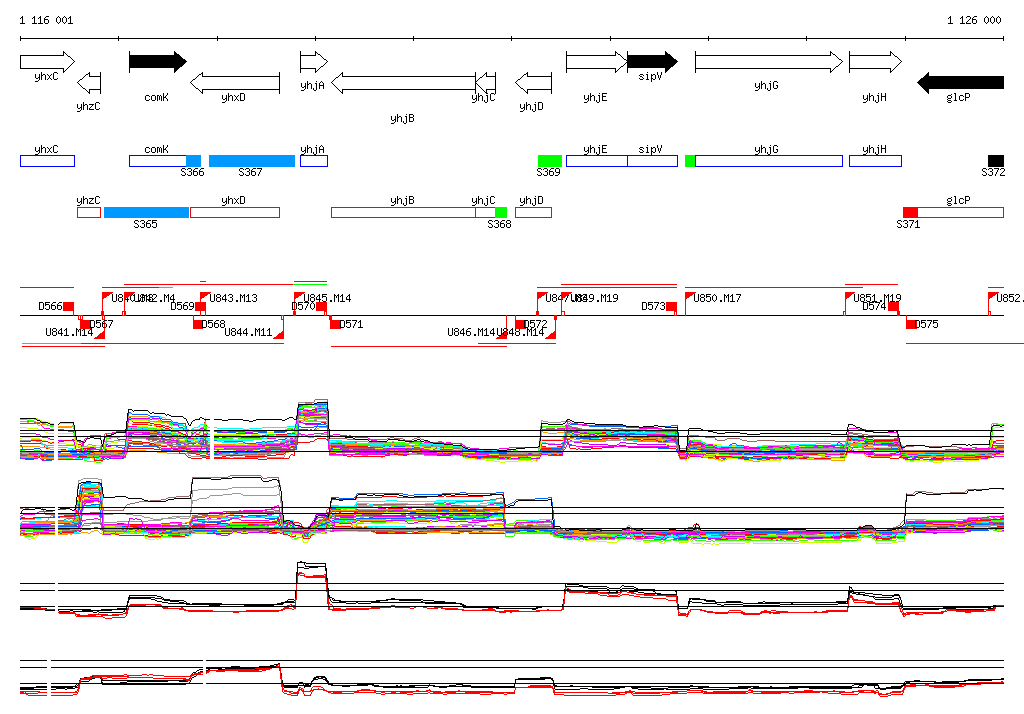
Genomic View of Gene/Segment S369
Show/Hide
(Legend)
Browse Genome Context