| Start Page |
|
 |
| Start Page |
|
|
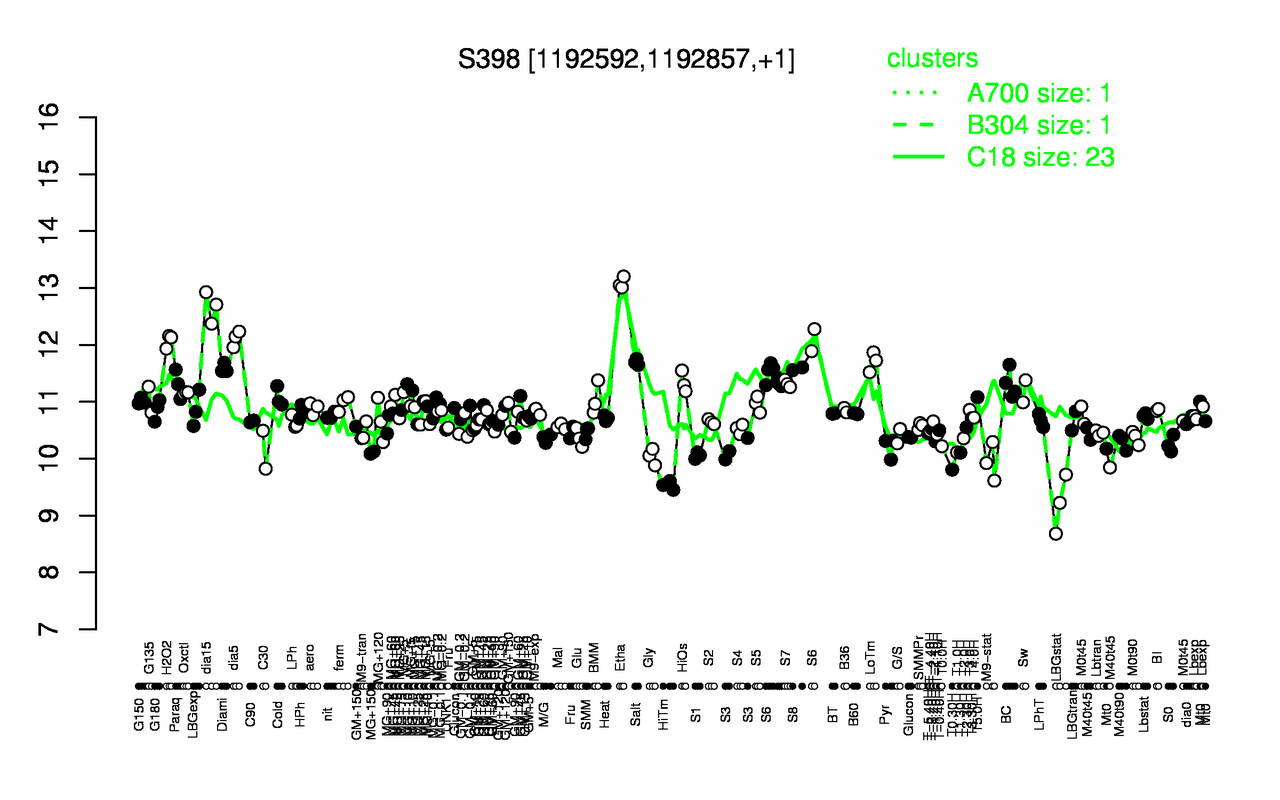
| Etha | dia15 | dia5 | H2O2 | LoTm | Salt | S6 | Diami | S8 | HiOs |
| 13.1 | 12.7 | 12.1 | 12.1 | 11.7 | 11.7 | 11.6 | 11.6 | 11.6 | 11.3 |
| LBGstat | HiTm | T0.30H | M9-stat | Gly | S1 | T1.30H | MG+150 | T1.0H | C30 |
| 9.21 | 9.53 | 9.81 | 9.94 | 10 | 10.1 | 10.1 | 10.1 | 10.1 | 10.2 |