B. subtilis Expression Data Browser
Start Page
B. subtilis Expression Data Browser
Gene/Segment:
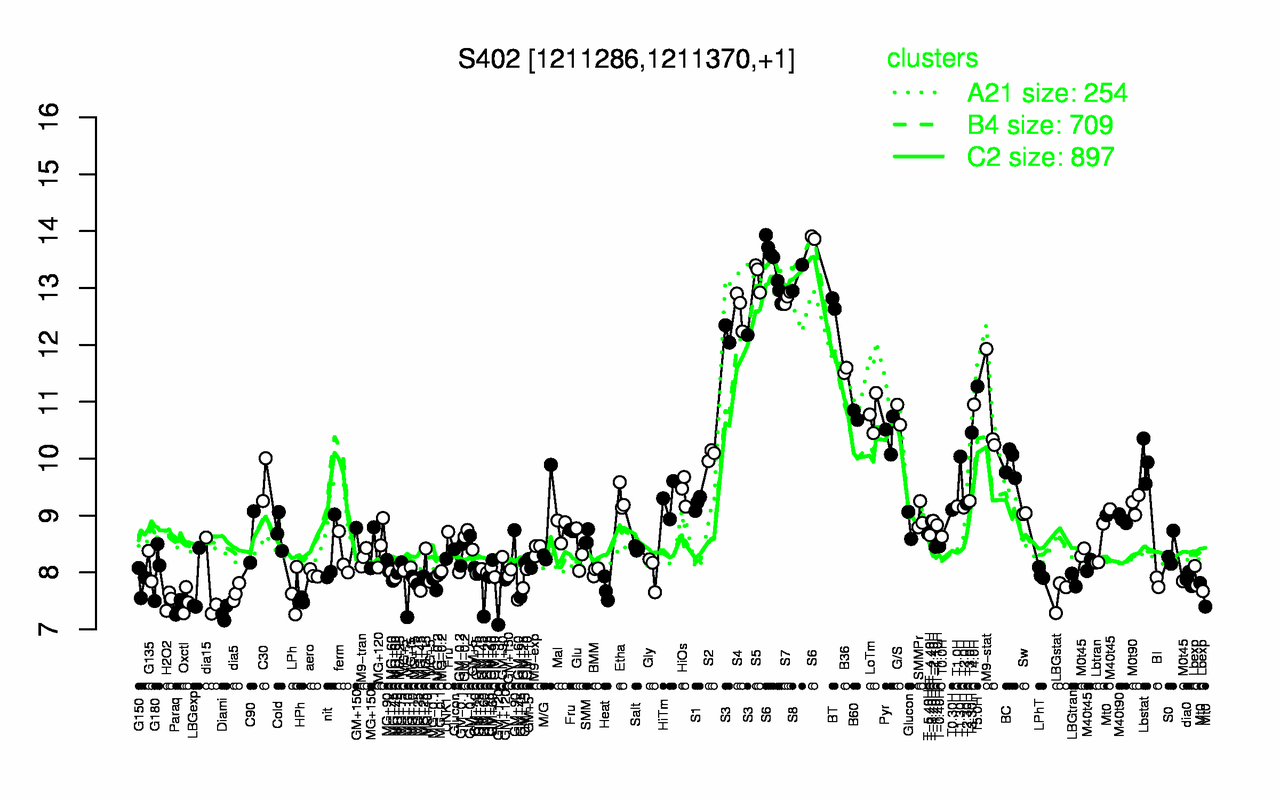
S402
Locus Tag:
new_1211286_1211370
Details about S402
Show/Hide
Highest Expression Conditions
S6
S5
S8
S7
BT
S4
S3
B36
T5.0H
T4.0H
13.5
13.2
13.2
12.8
12.7
12.6
12.2
11.6
11.3
11
Lowest Expression Conditions
Diami
Paraq
GM+120
Oxctl
H2O2
HPh
LBGstat
dia5
GM+60
LPh
7.28
7.36
7.48
7.5
7.5
7.51
7.61
7.65
7.65
7.66
Most Positively Correlated Segments
glnH
S738
S1041
yoyB
glnQ
yngI
yngHA
yngG
yngHB
glnM
0.93
0.93
0.93
0.93
0.93
0.93
0.92
0.92
0.92
0.92
Most Negatively Correlated Segments
S1480
dltD
ywdF
S378
yycJ
yeaD
sbcD
yebA
yvrG
dltC
-0.89
-0.89
-0.89
-0.89
-0.89
-0.89
-0.89
-0.88
-0.88
-0.88
Expression Profile of Segment S402
Show/Hide
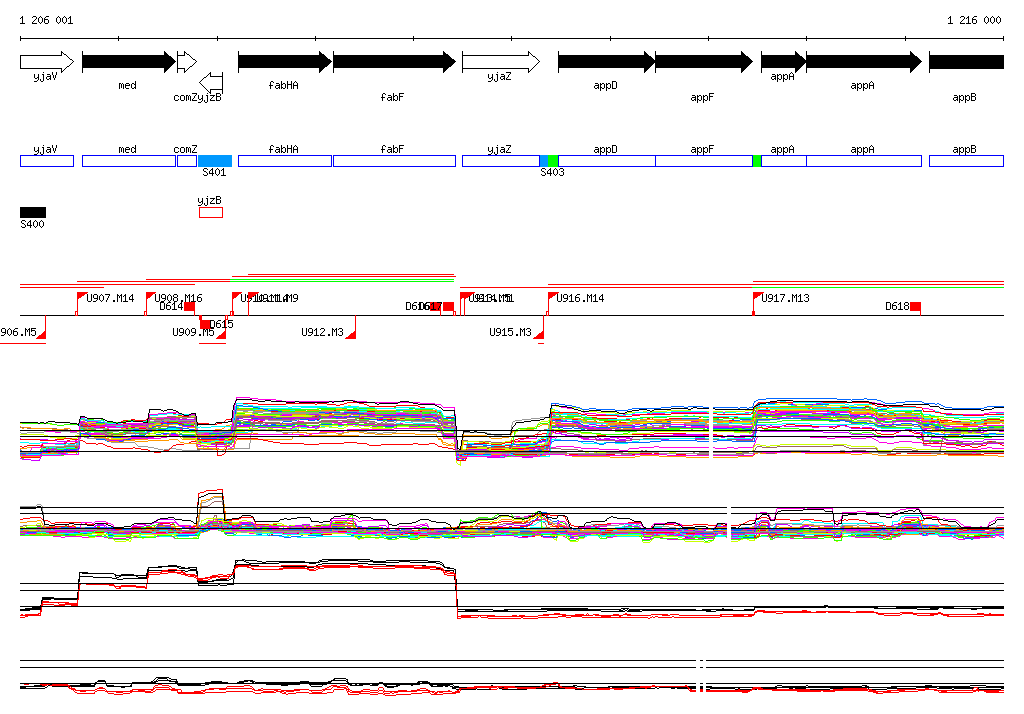
Genomic View of Gene/Segment S402
Show/Hide
(Legend)
Browse Genome Context