| Start Page |
|
 |
| Start Page |
|
|
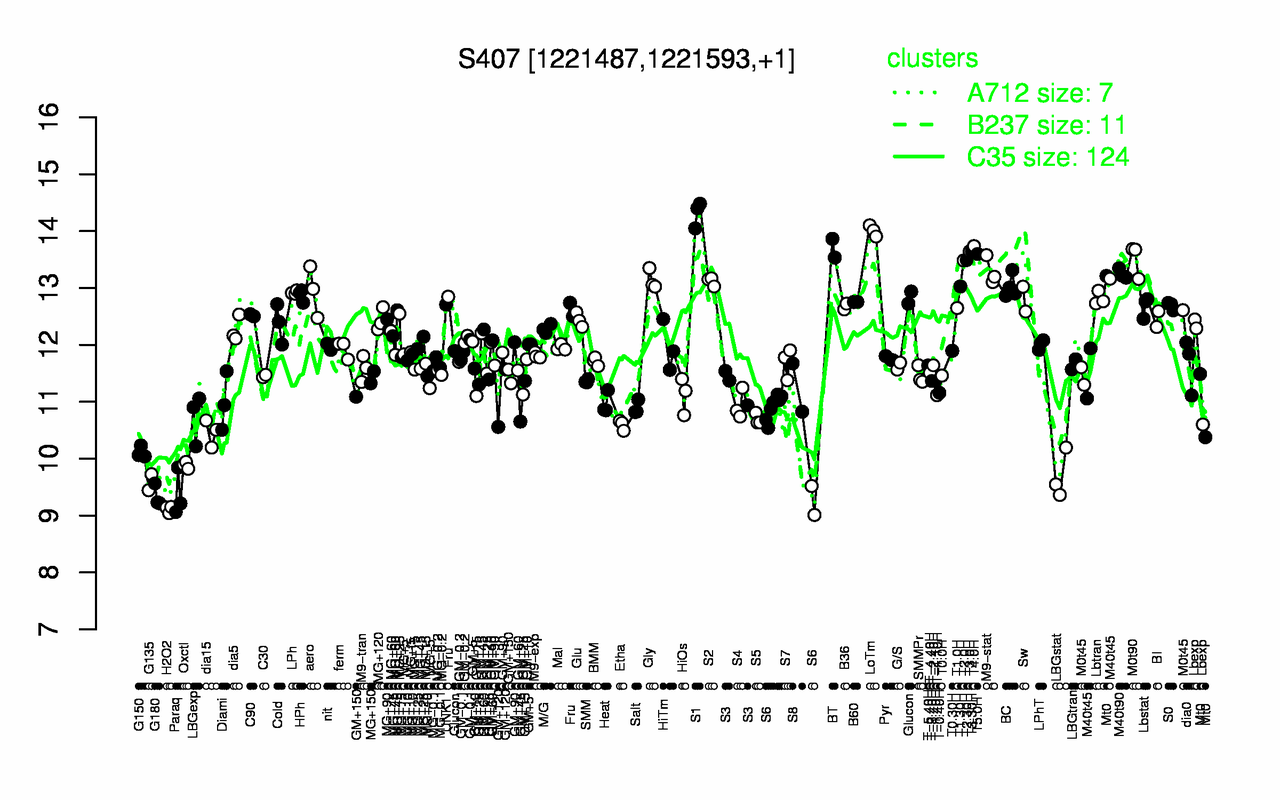
| S1 | LoTm | T4.0H | BT | T3.30H | T3.0H | T5.0H | M0t90 | T2.30H | T2.0H |
| 14.3 | 14 | 13.7 | 13.7 | 13.6 | 13.6 | 13.6 | 13.5 | 13.5 | 13.5 |
| H2O2 | G180 | Paraq | G135 | LBGstat | Oxctl | G150 | dia15 | S6 | Etha |
| 9.11 | 9.34 | 9.37 | 9.59 | 9.7 | 9.89 | 10.1 | 10.5 | 10.5 | 10.6 |