| Start Page |
|
 |
| Start Page |
|
|
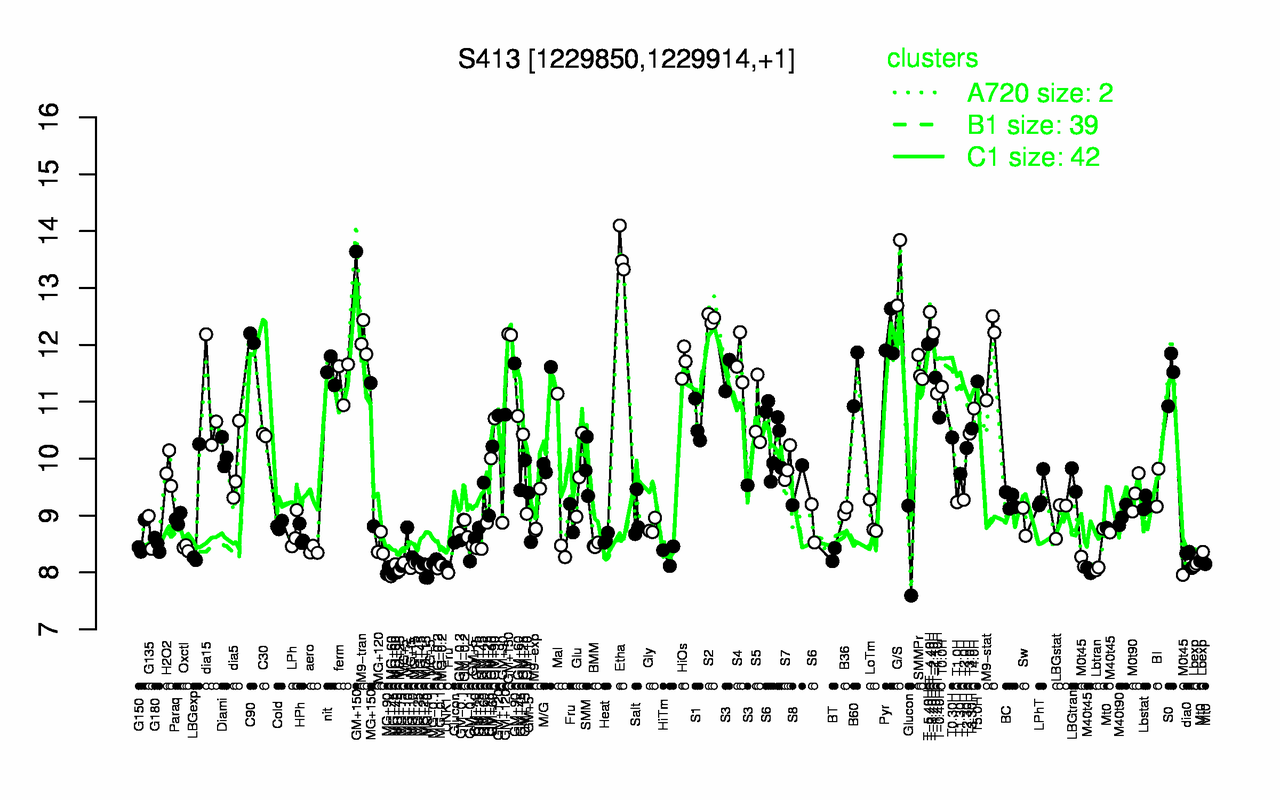
| Etha | G/S | GM+150 | T-4.40H | S2 | T-2.40H | Pyr | C90 | M9-tran | T-3.40H |
| 13.6 | 13.3 | 12.7 | 12.6 | 12.5 | 12.2 | 12.1 | 12.1 | 12.1 | 12.1 |
| MG+45 | MG+90 | MG+60 | MG+15 | MG+t5 | UNK1 | MG-0.2 | M0t45 | MG+25 | MG+5 |
| 8.02 | 8.03 | 8.04 | 8.06 | 8.08 | 8.09 | 8.1 | 8.11 | 8.12 | 8.16 |