B. subtilis Expression Data Browser
Start Page
B. subtilis Expression Data Browser
Gene/Segment:
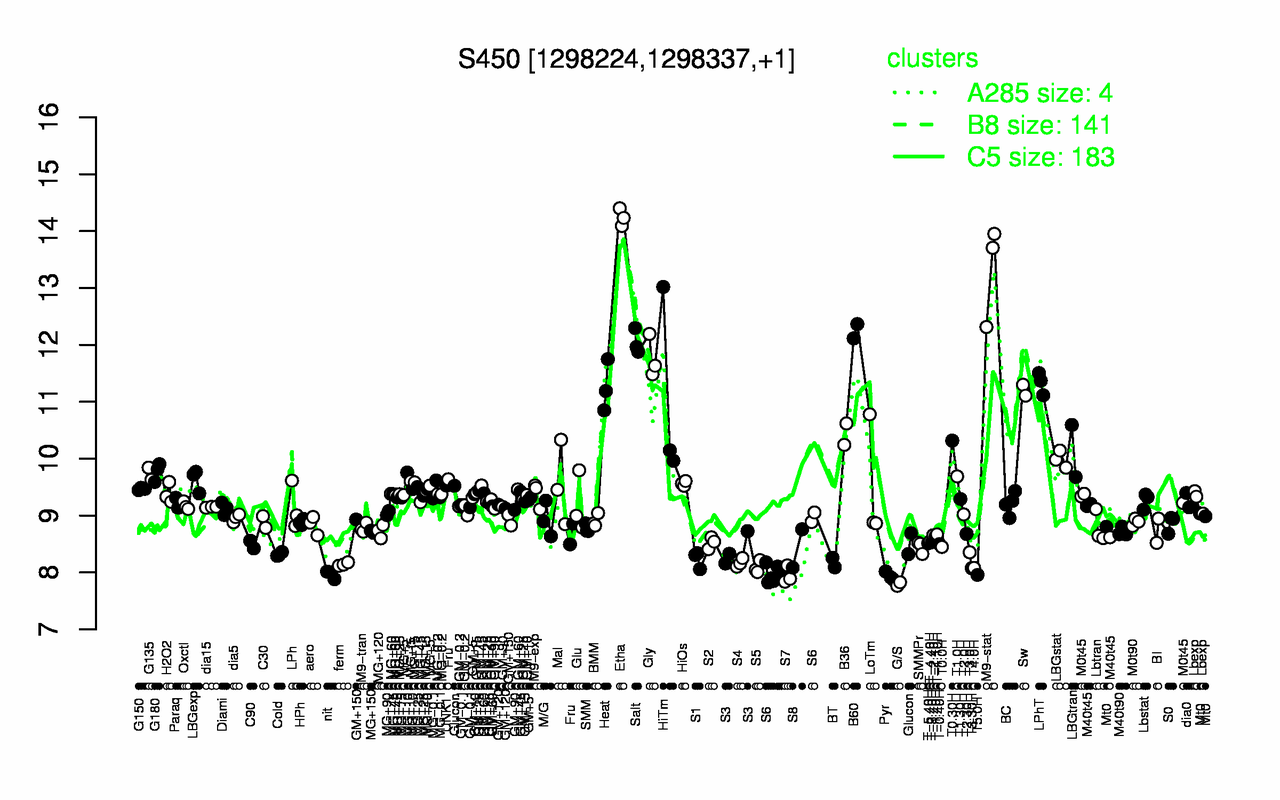
S450
Locus Tag:
new_1298224_1298337
Details about S450
Show/Hide
Highest Expression Conditions
Etha
M9-stat
B60
Salt
Gly
LPhT
Heat
Sw
HiTm
B36
14.2
13.3
12.2
12
11.8
11.3
11.3
11.2
11
10.4
Lowest Expression Conditions
G/S
Pyr
S7
T5.0H
nit
T3.30H
T4.0H
S5
ferm
S4
7.8
7.94
7.95
7.96
7.97
8.08
8.08
8.09
8.14
8.17
Most Positively Correlated Segments
yjlB
ydaP
ydaD
ydbD
ydaE
yqhB
yerD
yaaI
ycdF
S276
0.98
0.88
0.88
0.87
0.86
0.85
0.85
0.84
0.84
0.84
Most Negatively Correlated Segments
sspL
S122
S832
nucA
amyX
S1583
nin
ndoA
yqjV
yloV
-0.49
-0.48
-0.48
-0.47
-0.47
-0.45
-0.44
-0.44
-0.44
-0.44
Expression Profile of Segment S450
Show/Hide
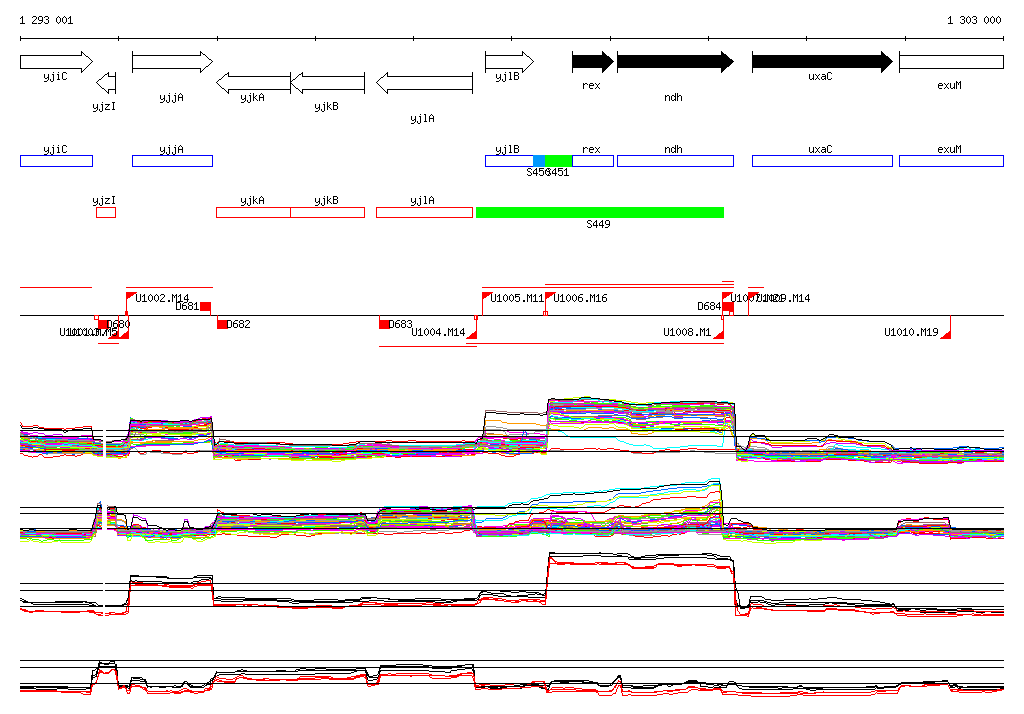
Genomic View of Gene/Segment S450
Show/Hide
(Legend)
Browse Genome Context