| Start Page |
|
 |
| Start Page |
|
|
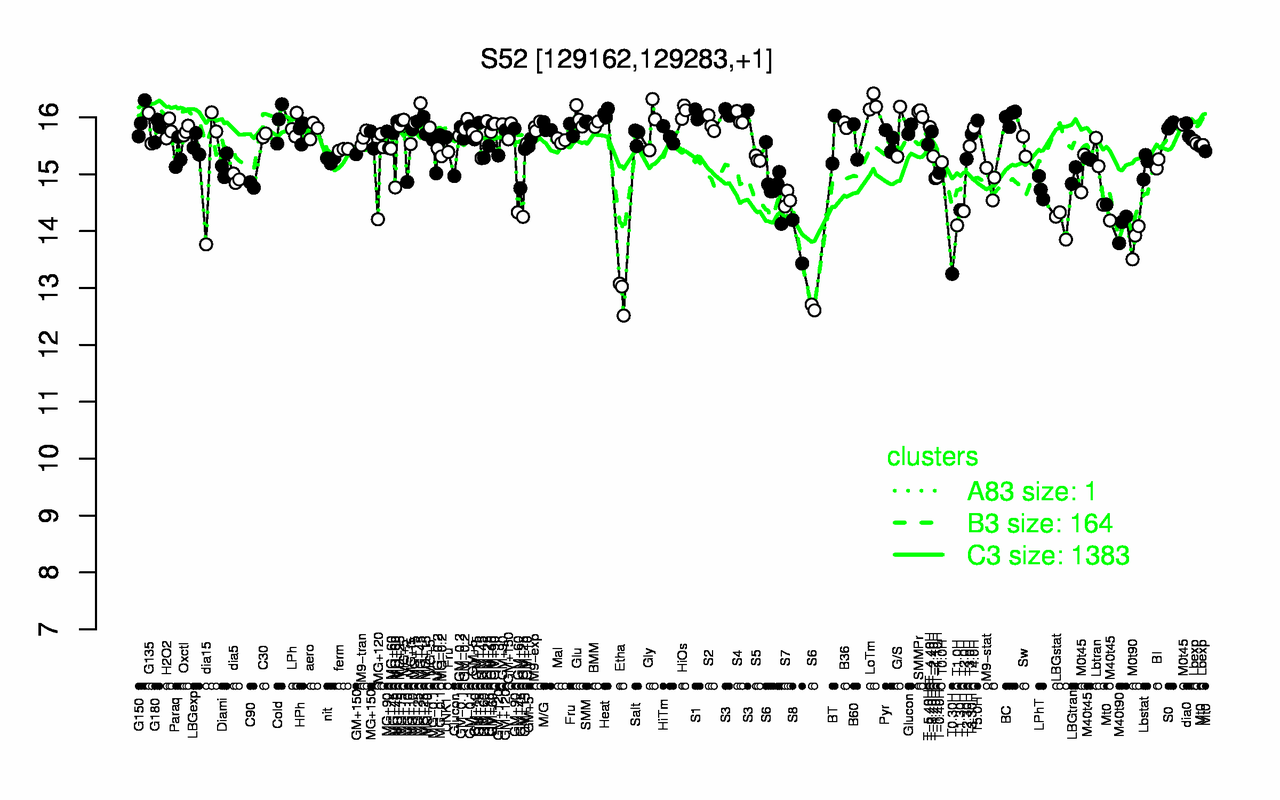
| LoTm | HiOs | S3 | SMMPr | Heat | S1 | BC | Glu | S4 | MG+45 |
| 16.2 | 16.1 | 16.1 | 16.1 | 16.1 | 16 | 16 | 16 | 16 | 16 |
| Etha | T0.30H | S8 | M0t90 | M40t90 | T1.0H | LBGstat | S6 | T2.0H | T1.30H |
| 12.9 | 13.2 | 13.8 | 13.8 | 14.1 | 14.1 | 14.1 | 14.3 | 14.3 | 14.4 |