| Start Page |
|
 |
| Start Page |
|
|
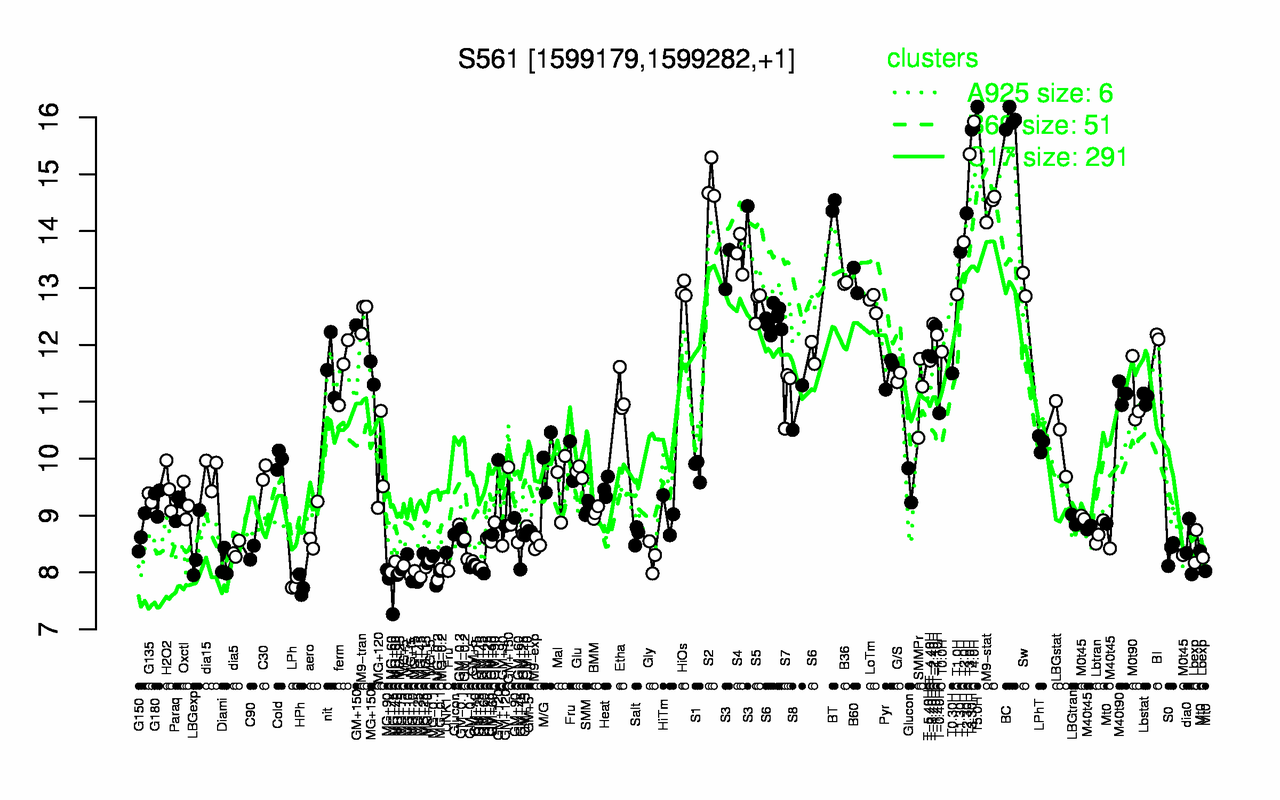
| T5.0H | BC | T4.0H | T3.30H | T3.0H | S2 | BT | M9-stat | T2.30H | T2.0H |
| 16.2 | 16 | 15.9 | 15.8 | 15.4 | 14.9 | 14.5 | 14.4 | 14.3 | 13.8 |
| MG+45 | HPh | LPh | MG+t5 | MG-0.2 | MG+90 | MG-0.1 | MG+25 | MG+15 | MG+60 |
| 7.71 | 7.77 | 7.8 | 7.94 | 7.96 | 7.97 | 8.03 | 8.06 | 8.06 | 8.1 |