| Start Page |
|
 |
| Start Page |
|
|
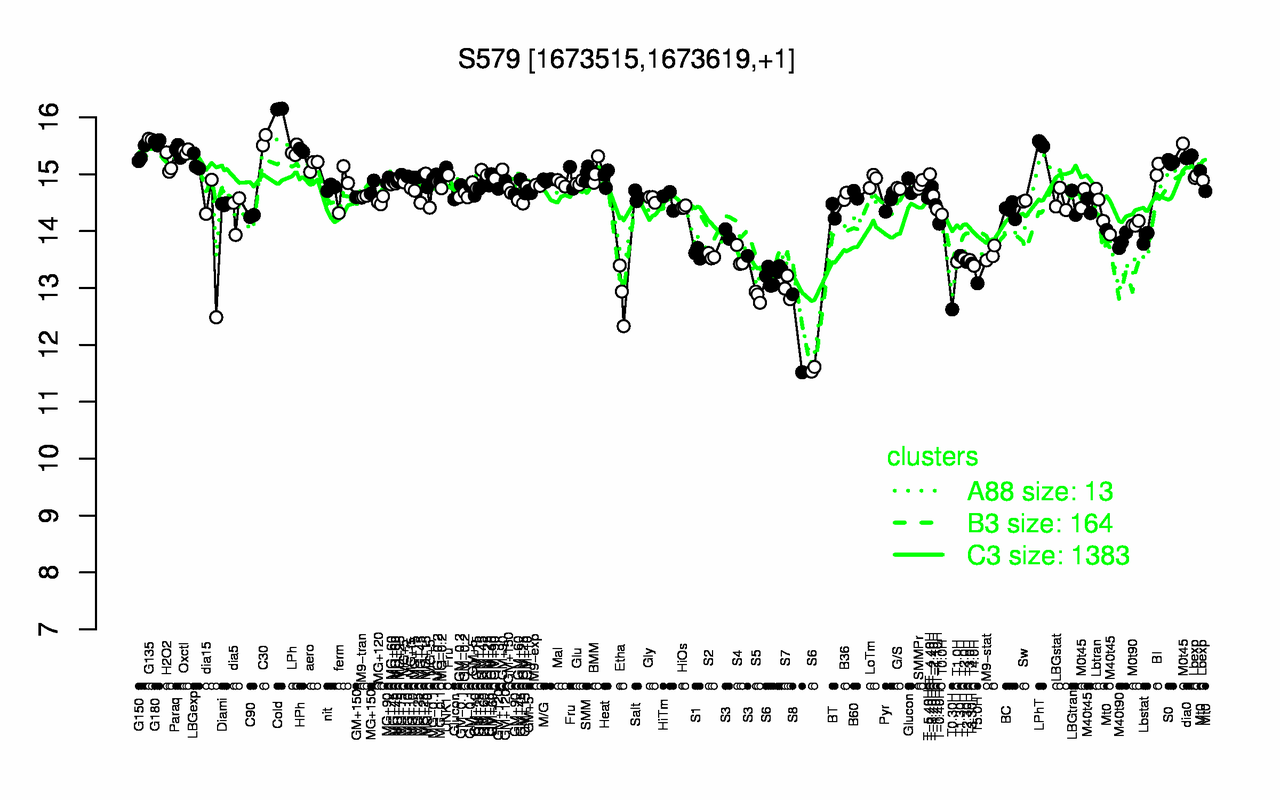
| Cold | G135 | C30 | G180 | LPhT | HPh | Paraq | LPh | Oxctl | G150 |
| 16.1 | 15.6 | 15.6 | 15.6 | 15.5 | 15.4 | 15.4 | 15.4 | 15.4 | 15.3 |
| S8 | T0.30H | S5 | S6 | Etha | S7 | T5.0H | T4.0H | T3.30H | T2.30H |
| 12.2 | 12.6 | 12.9 | 12.9 | 12.9 | 13 | 13.1 | 13.4 | 13.4 | 13.5 |