B. subtilis Expression Data Browser
Details about S586 Show/Hide
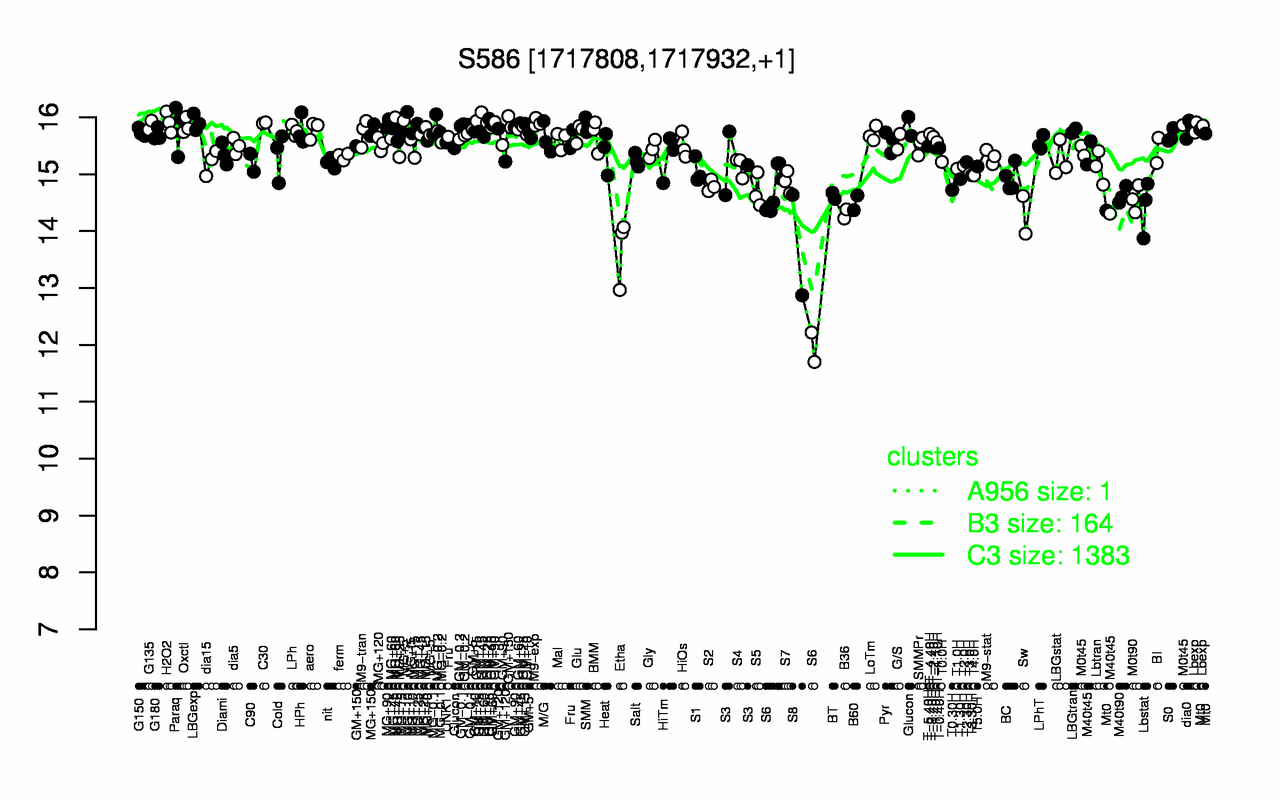
Highest Expression Conditions
GM+45 GM+15 H2O2 M9-exp LBGexp C30 MG+90 GM-0.1 G135 SMM
15.9 15.9 15.9 15.9 15.9 15.9 15.9 15.9 15.9 15.9
Lowest Expression Conditions
Etha S8 S6 Sw B36 Lbstat B60 M0t90 BT M40t90
13.7 13.8 14.1 14.3 14.3 14.4 14.5 14.6 14.6 14.6
Most Positively Correlated Segments
rpsF rpsB ssbA rplC S1135 murE rpsJ rpsC S55 rplV
0.87 0.87 0.86 0.85 0.85 0.85 0.84 0.83 0.83 0.83
Most Negatively Correlated Segments
yrzF fadE yqaC yteS ytvB yugM yteP yjaZ fadN yesU
-0.73 -0.69 -0.68 -0.68 -0.68 -0.67 -0.67 -0.67 -0.67 -0.66
Expression Profile of Segment S586 Show/Hide
Genomic View of Gene/Segment S586 Show/Hide
(Legend)