B. subtilis Expression Data Browser
Start Page
B. subtilis Expression Data Browser
Gene/Segment:
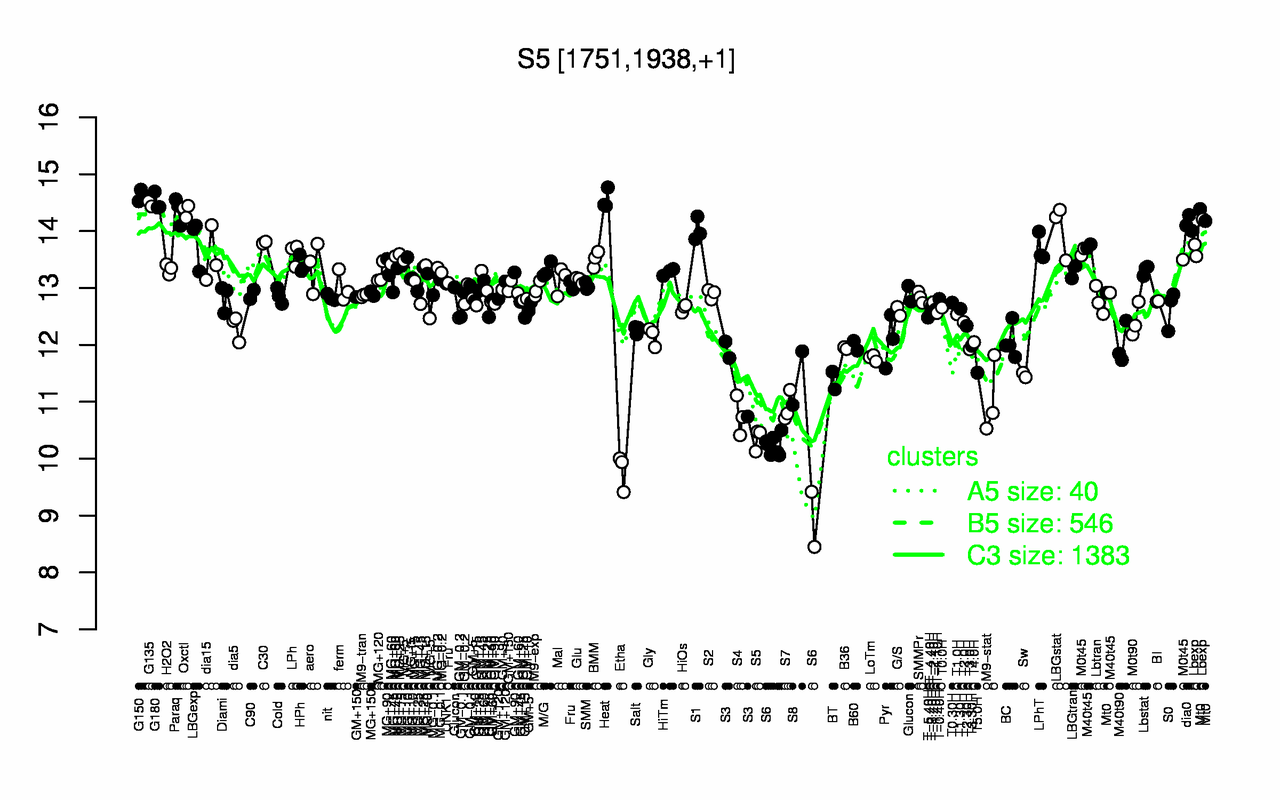
S5
Locus Tag:
new_1751_1938
Details about S5
Show/Hide
Highest Expression Conditions
G150
Heat
G180
G135
Paraq
Oxctl
dia0
LBGstat
S1
Lbexp
14.6
14.6
14.5
14.5
14.4
14.4
14.1
14
14
13.8
Lowest Expression Conditions
Etha
S6
S5
S4
S7
M9-stat
BT
S8
Sw
T5.0H
9.79
9.95
10.4
10.8
10.9
11.1
11.4
11.4
11.5
11.5
Most Positively Correlated Segments
dnaN
dnaA
yflE
S3
yycJ
dacA
spcB
yvcD
ltaSA
S1201
0.96
0.92
0.89
0.86
0.85
0.85
0.85
0.85
0.85
0.84
Most Negatively Correlated Segments
glnH
glnQ
yojJ
mpr
yhzD
glnM
yngF
yngE
yngHA
S1158
-0.8
-0.79
-0.79
-0.78
-0.78
-0.78
-0.78
-0.78
-0.78
-0.78
Expression Profile of Segment S5
Show/Hide
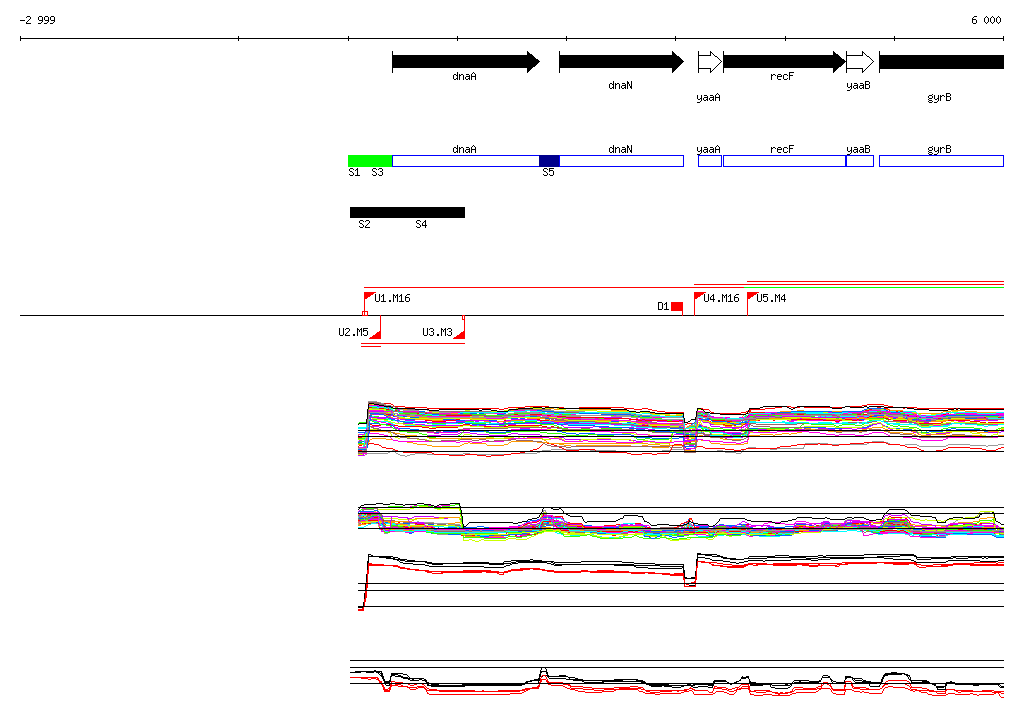
Genomic View of Gene/Segment S5
Show/Hide
(Legend)
Browse Genome Context