B. subtilis Expression Data Browser
Start Page
B. subtilis Expression Data Browser
Gene/Segment:
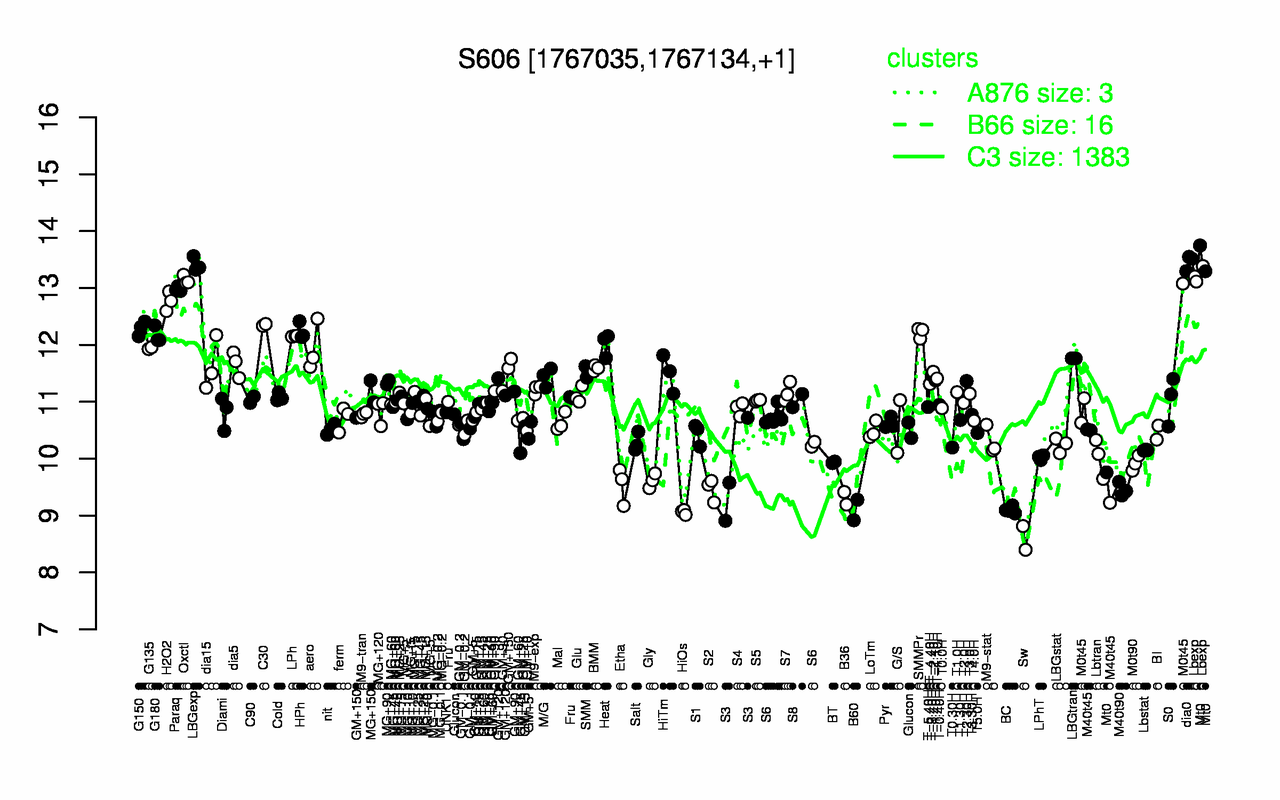
S606
Locus Tag:
new_1767035_1767134
Details about S606
Show/Hide
Highest Expression Conditions
dia0
LBGexp
Lbexp
Oxctl
Paraq
H2O2
C30
G150
Mt0
HPh
13.5
13.4
13.2
13.1
13
12.8
12.4
12.3
12.3
12.2
Lowest Expression Conditions
Sw
HiOs
B60
BC
B36
M40t90
S2
Etha
Gly
S3
8.61
9.06
9.1
9.1
9.3
9.46
9.46
9.54
9.61
9.73
Most Positively Correlated Segments
pbpX
S527
speB
speE
S1036
dxr
pyrG
S239
yutK
yhcK
0.96
0.82
0.77
0.76
0.76
0.74
0.74
0.72
0.72
0.72
Most Negatively Correlated Segments
yisT
yjcF
S1413
ureA
yjcG
scuA
ureB
dat
yvyD
dacC
-0.76
-0.73
-0.73
-0.73
-0.73
-0.72
-0.71
-0.7
-0.7
-0.69
Expression Profile of Segment S606
Show/Hide
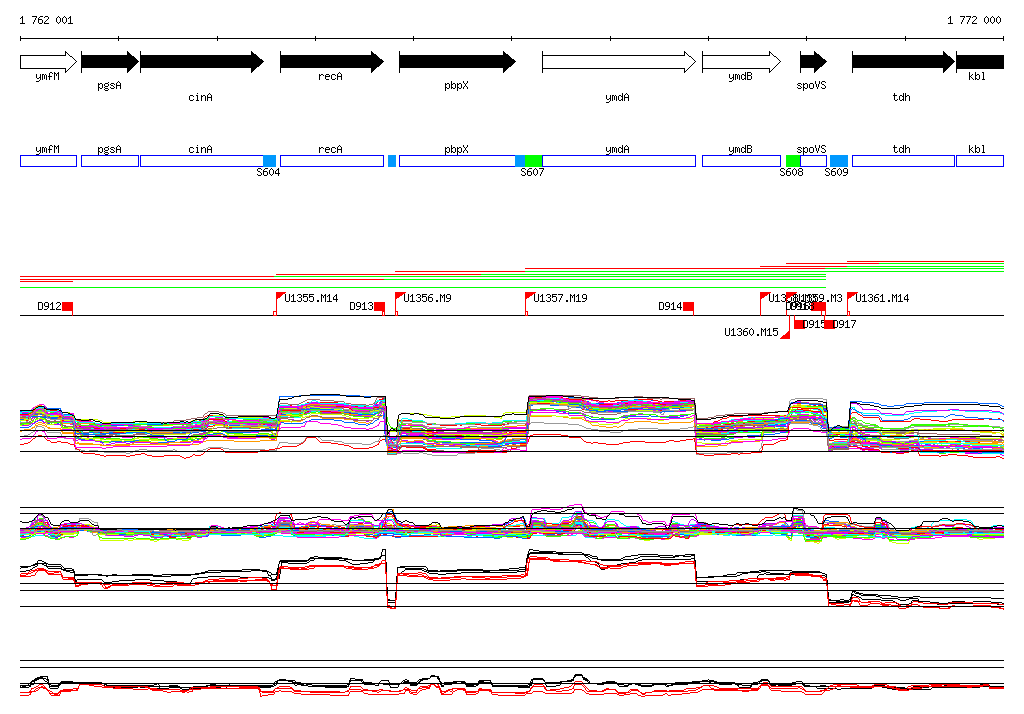
Genomic View of Gene/Segment S606
Show/Hide
(Legend)
Browse Genome Context