| Start Page |
|
 |
| Start Page |
|
|
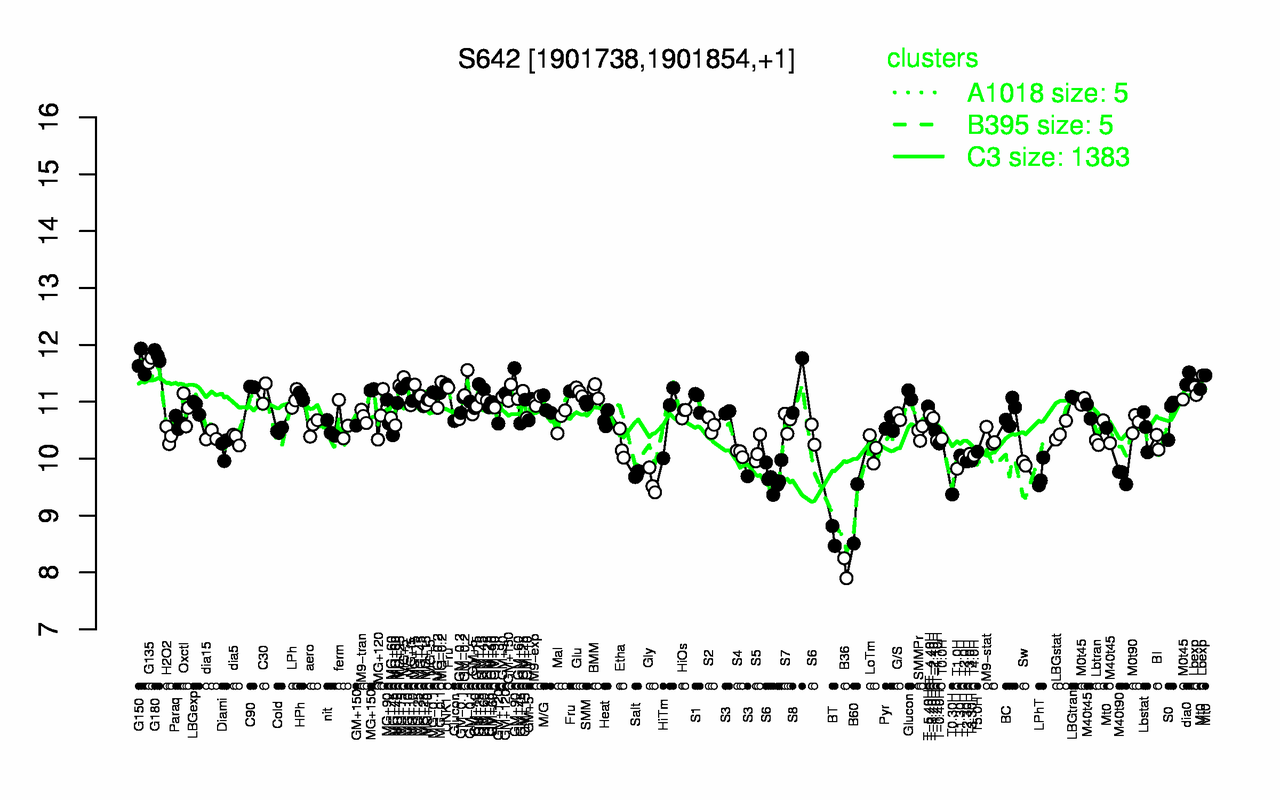
| G180 | G135 | G150 | dia0 | UNK1 | S8 | Lbexp | C90 | MG+5 | MG+150 |
| 11.8 | 11.7 | 11.7 | 11.4 | 11.3 | 11.3 | 11.3 | 11.3 | 11.2 | 11.2 |
| B36 | BT | B60 | T0.30H | Gly | M40t90 | Salt | LPhT | T1.0H | S6 |
| 8.07 | 8.64 | 9.03 | 9.37 | 9.59 | 9.69 | 9.72 | 9.72 | 9.82 | 9.84 |