| Start Page |
|
 |
| Start Page |
|
|
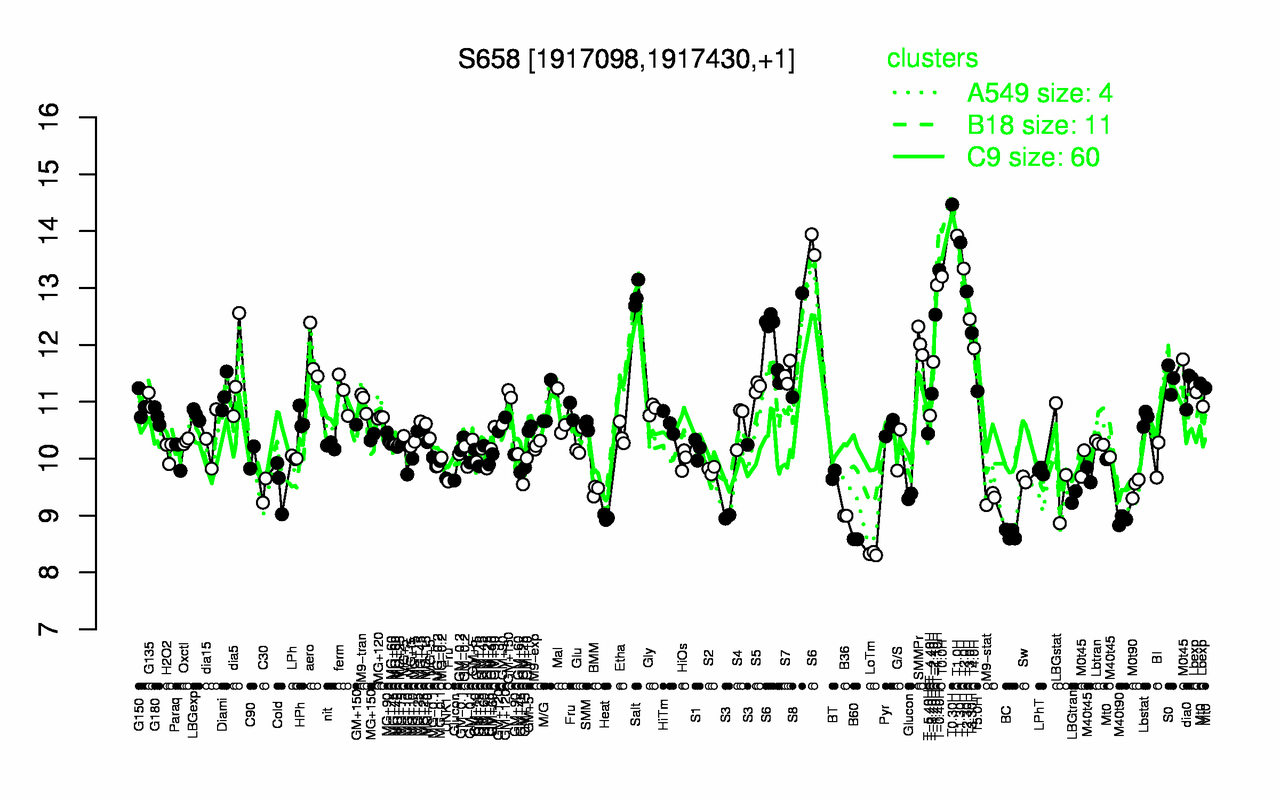
| T0.30H | T1.0H | T1.30H | T2.0H | T-0.40H | T0.0H | T-1.10H | T2.30H | Salt | T-1.40H |
| 14.5 | 13.9 | 13.8 | 13.3 | 13.3 | 13.2 | 13 | 12.9 | 12.9 | 12.5 |
| LoTm | B60 | BC | M40t90 | Heat | B36 | M9-stat | LBGtran | S3 | Glucon |
| 8.33 | 8.58 | 8.67 | 8.92 | 8.97 | 9 | 9.3 | 9.33 | 9.4 | 9.43 |