| Start Page |
|
 |
| Start Page |
|
|
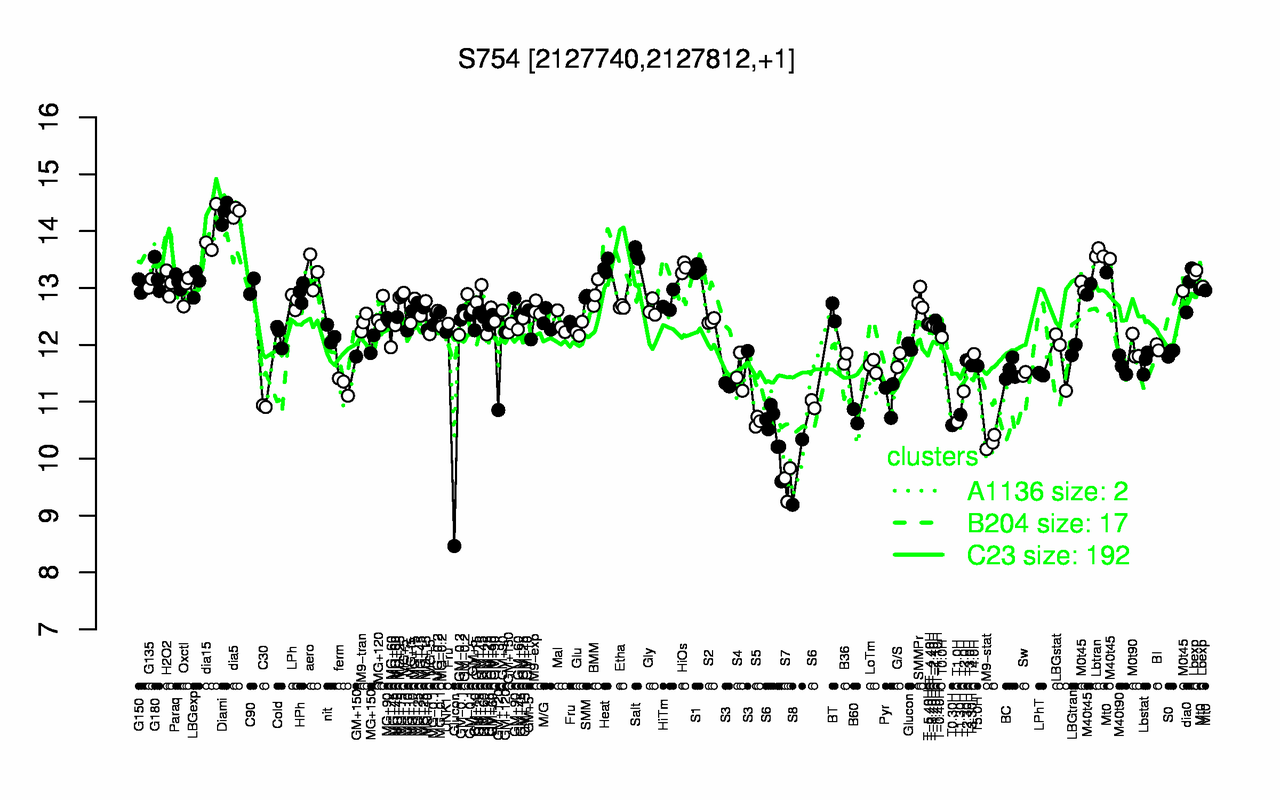
| dia5 | Diami | dia15 | Salt | Lbtran | Heat | HiOs | S1 | aero | G180 |
| 14.3 | 14.3 | 14 | 13.6 | 13.6 | 13.4 | 13.4 | 13.3 | 13.3 | 13.2 |
| S7 | S8 | M9-stat | S6 | T0.30H | T1.0H | S5 | B60 | T1.30H | Glucon |
| 9.58 | 9.76 | 10.3 | 10.5 | 10.6 | 10.6 | 10.7 | 10.7 | 10.8 | 10.8 |