| Start Page |
|
 |
| Start Page |
|
|
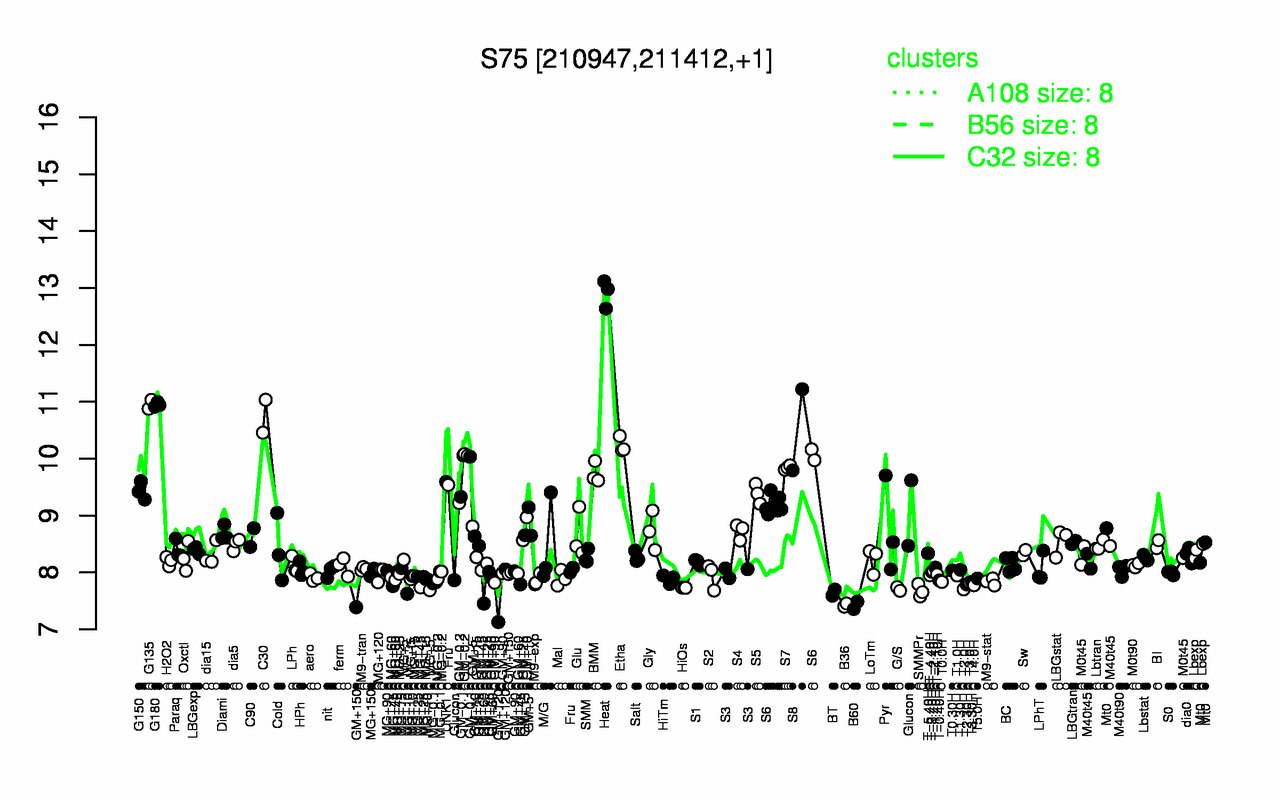
| Heat | G135 | G180 | C30 | S8 | Etha | S7 | GM-0.1 | GM-0.2 | BMM |
| 12.9 | 11 | 11 | 10.7 | 10.5 | 10.2 | 9.84 | 9.81 | 9.78 | 9.74 |
| B60 | B36 | GM+120 | BT | SMMPr | T2.0H | G/S | HiOs | T4.0H | T2.30H |
| 7.42 | 7.43 | 7.59 | 7.64 | 7.68 | 7.7 | 7.71 | 7.73 | 7.78 | 7.79 |